- Accessing Clobba
- Welcome screen
- Icons Explained
- Menu Options
- Dashboard Options
- Max Ringtime
- Subnet Quality
- Top Diagnostic ID Failures
- Call Type Summary
- Client Types
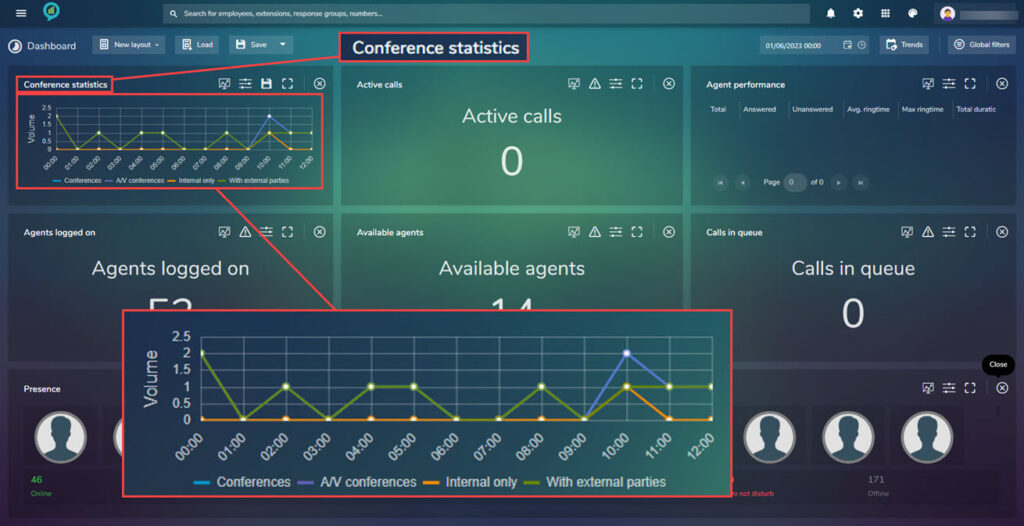
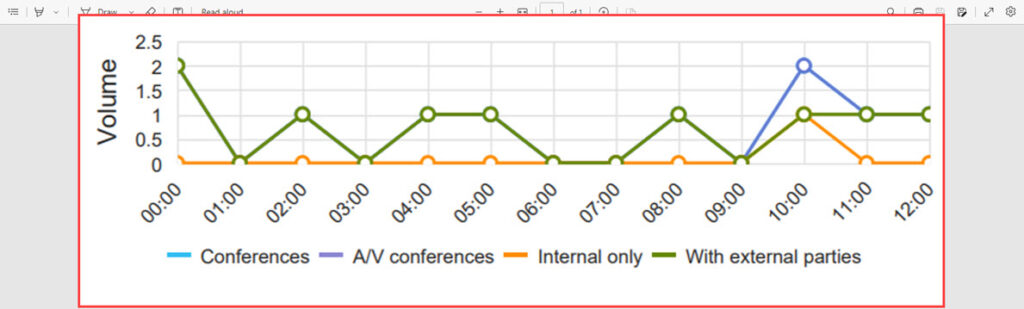
- Conference Statistics
- Active Calls
- Agent Performance (Grid)
- Agent Performance (View)
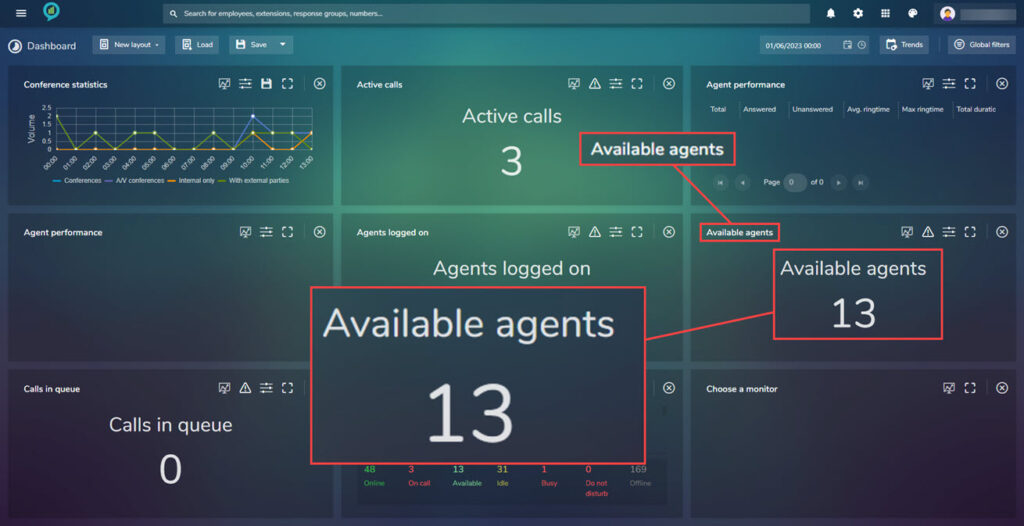
- Agents Logged On
- Available Agents
- Calls In Queue
- Presence
- Reports
- Trend analytics
- Adoption
- Quality index
- Calls
- Conferences
- Auto Attendants
- Queues
- Glossary
Clobba is a monitoring and reporting solution which delivers a 360-degree view of Unified Communications usage and associated costs.
Trends in the usage of voice, video, IM, conferences, file transfers and application sharing can be tracked to highlight user acceptance, performance metric and cost savings which enables more effective use of resources. Our solution is easy to use, displaying information in a simple to view format suitable for use by any employee within an organization, removing the need for any time-consuming manual process.
This solution is developed with the latest Microsoft technologies meaning you can run it within any web browser. Reports are created using Microsoft reporting tools enabling you to save reports in PDF, Word, Excel. Reports can be scheduled and sent to an email or saved on a server.
Accessing Clobba
To access the software type in the browser the name of the server/clobba
(ask your admin what the server name needed is)
This will open a log in screen.
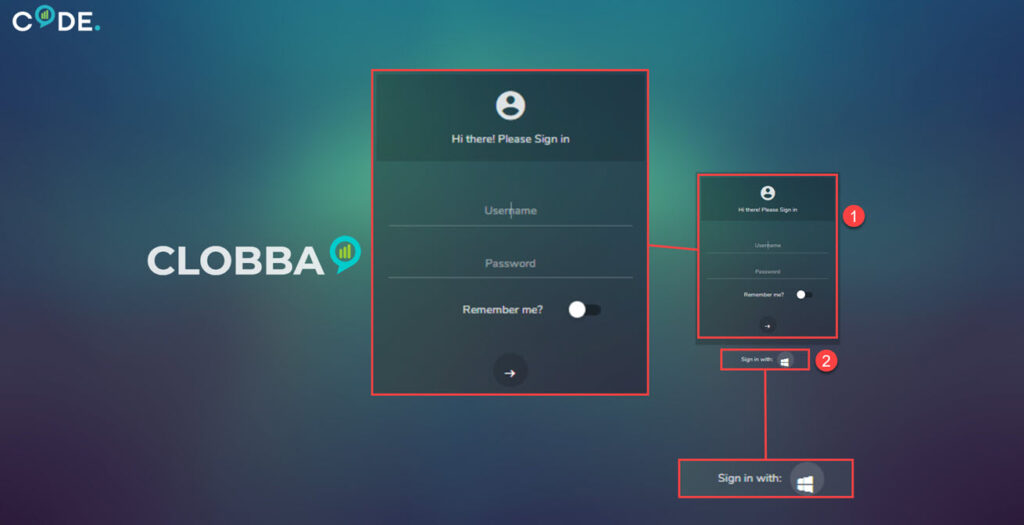
There are two ways of authenticating into the system:
- First is the usual way of using a username and password, this is based on the security policies that have been set in the back end by your system administrator. They will have the ability to choose what can be seen, this could be all data, department specific or just your own data. Check the Remember me if you are the only user of the machine.
- The second way is by using the active directory authentication. Clobba will synchronize with active directory, it will authenticate without the need of another user name and password. It will use your data from the authenticator. (Highlighted option in above image)*Best practice is to use the active directory authenticator*
Welcome screen
Once logged in, the user should be greeted with the welcome screen. There are menu options in both the top left and right of the screen and a search in the middle:
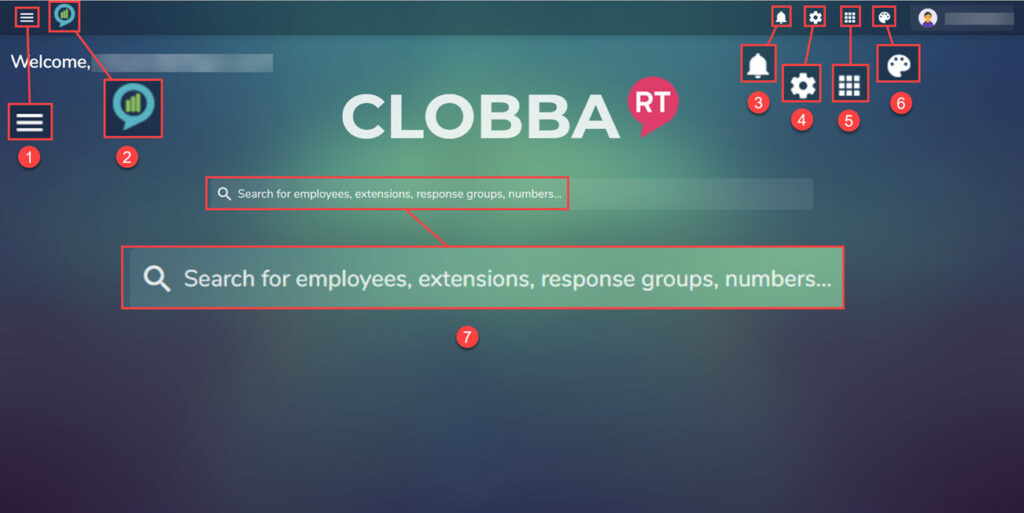
- Sidebar – Opens a menu.
- Home button – Takes you back to the home screen.
- Notifications – Click to read notification, a dot will appear on the bell to let you know you have a notification.
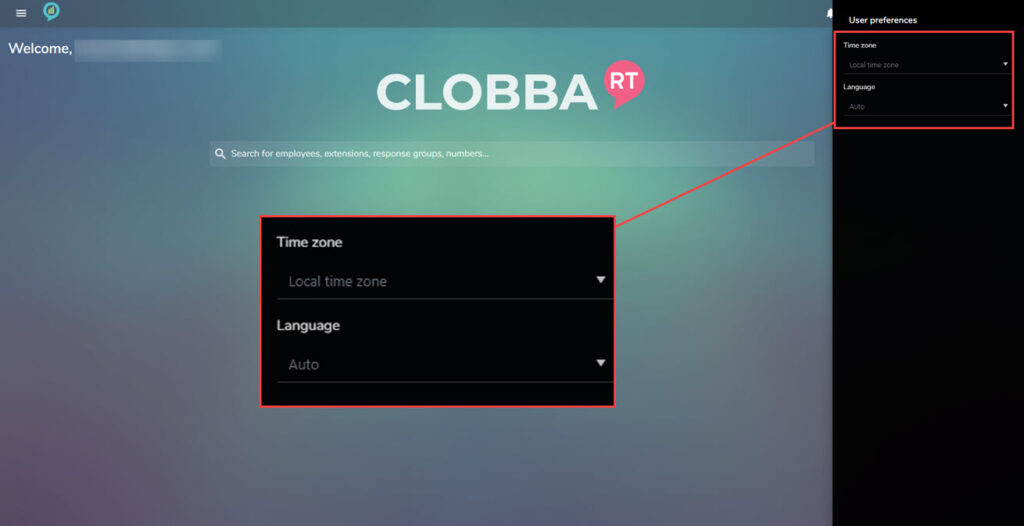
- Application Settings – Allows changes of the Time Zone and Language.
- Modules – Other Clobba Modules can be accessed from here.
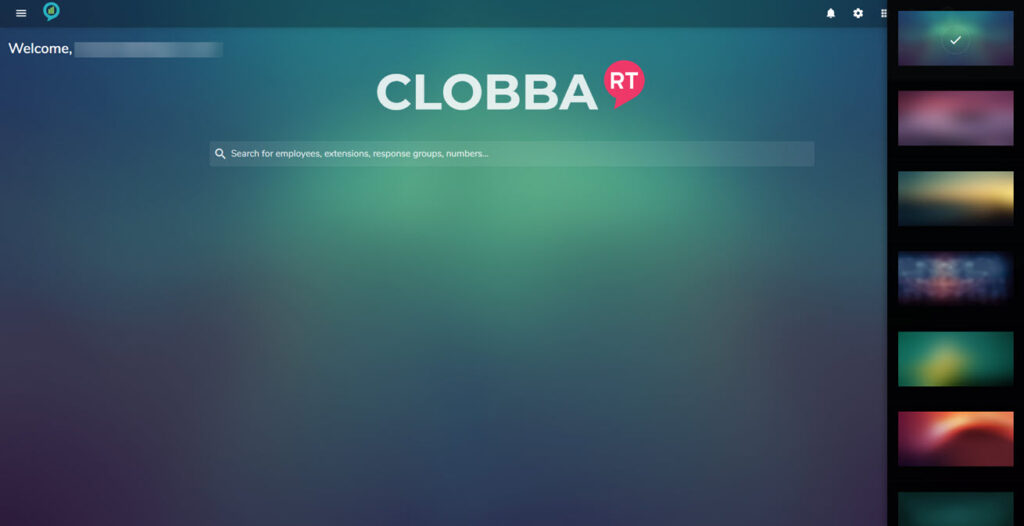
- Themes – Change the background color.
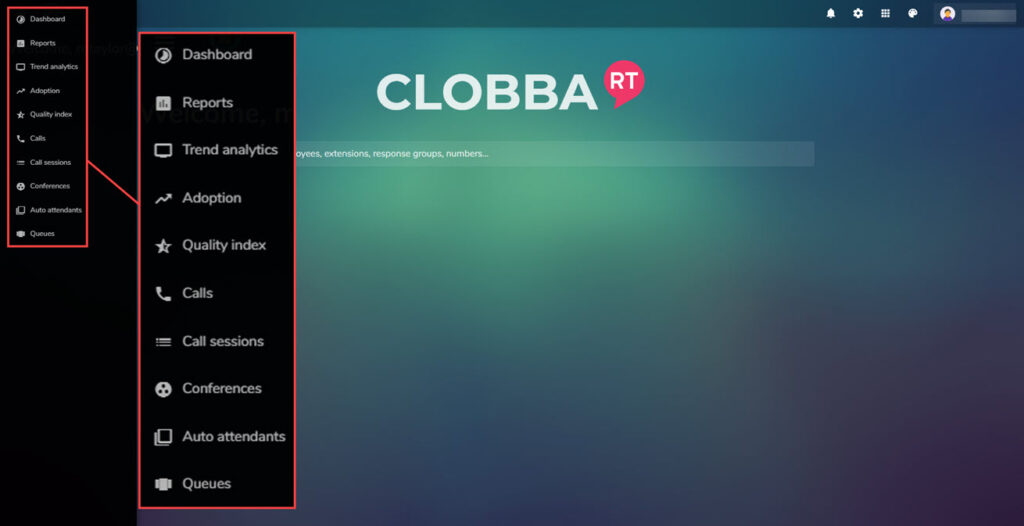
Icons Explained
- Clicking on the sidebar icon (1) will open the menu of options:
- Clicking on the home button icon (2) returns the user back to the home screen. This icon is available in most screens for a quick way back to the home screen.
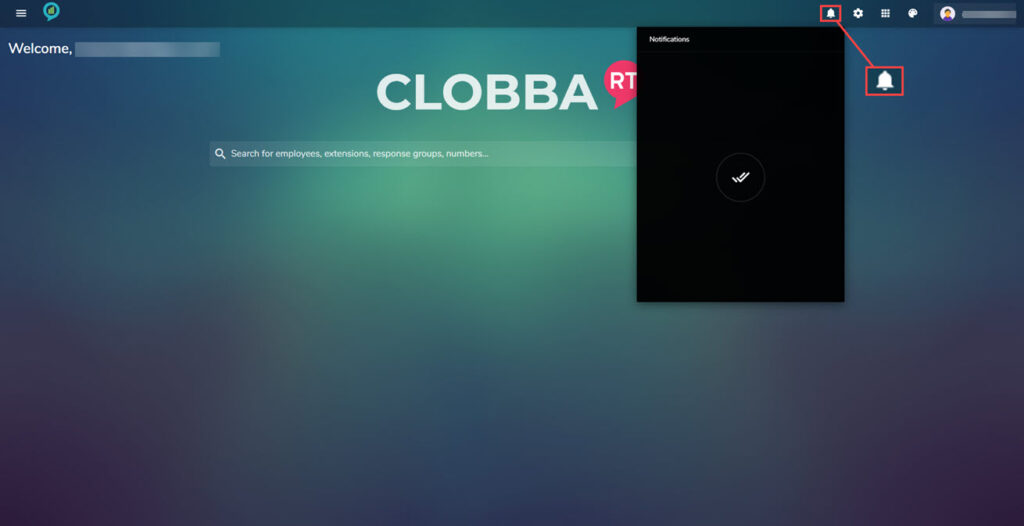
- Clicking the notification icon (3) will show any notifications received:
- The application icon (4) shows the setting options that you can change to suit your needs:
- The module icon (5) shows the other Clobba modules that can be accessed from here this example we have the following options:
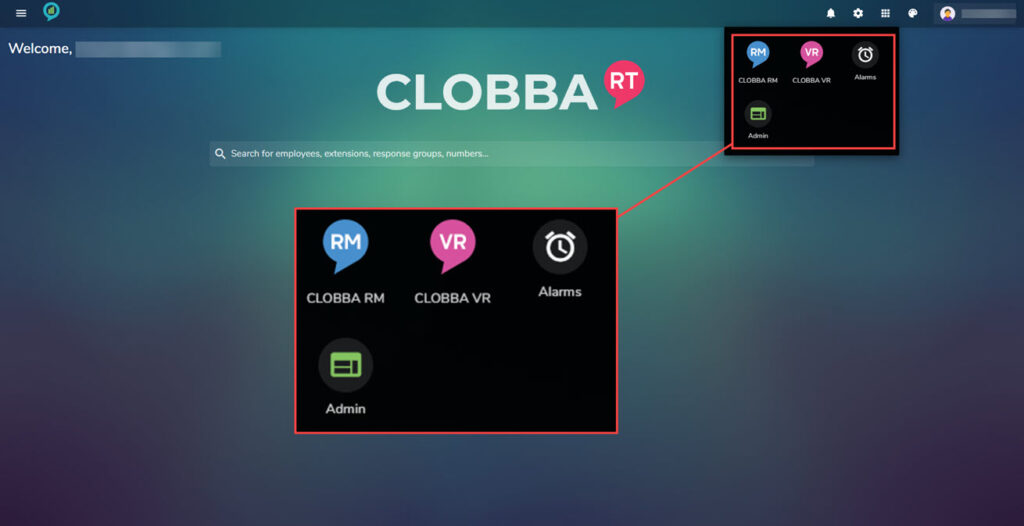
- Clobba RM – Range Manager
- Clobba VR – Voice Recorder
- Alarms – Allow you to create alarms based on data
- Admin – A screen with a menu of admin settings
- The themes icon (6) gives a choice of themes:
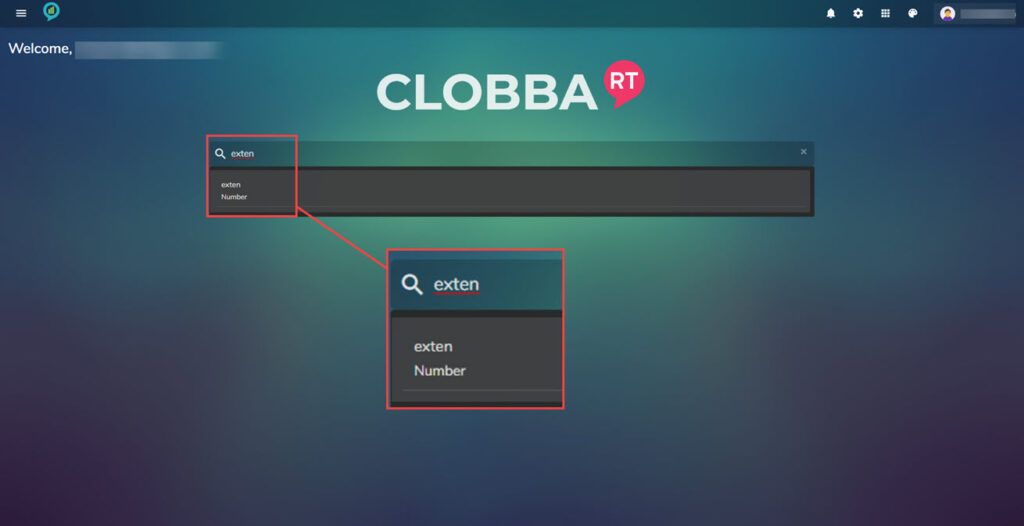
- The search bar.
When using the search bar a drop down of options will appear as text is added, for example:
Menu Options
This section will cover the options mentioned above. Starting with the top left-hand side menu.
Dashboard
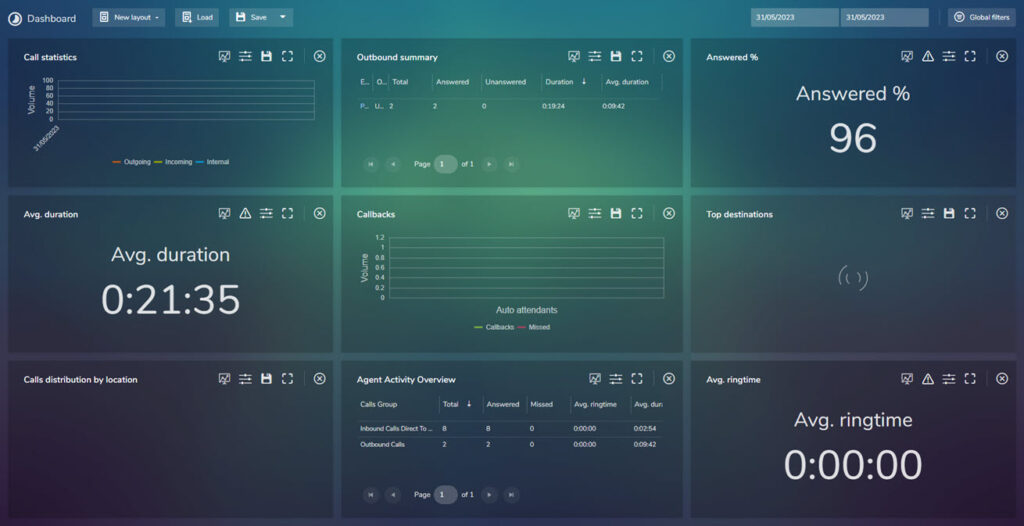
Clicking on Dashboard will open up the dashboard view based on the current settings. for example:
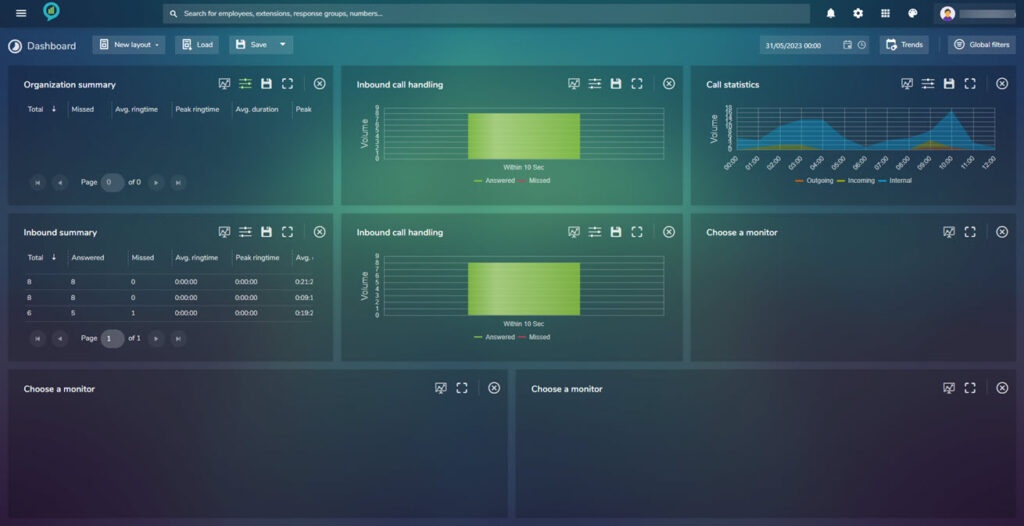
As you can see in here there are many options to customize depending on needs.
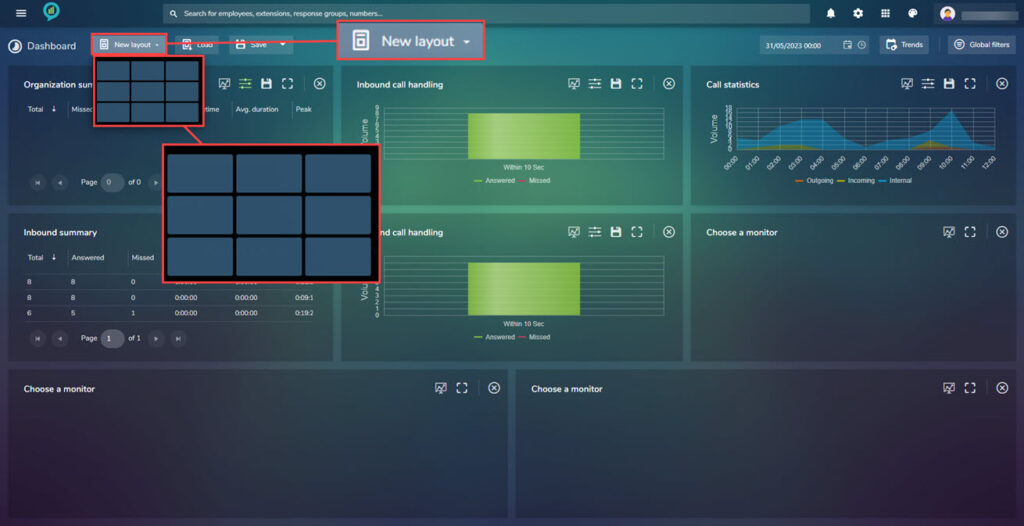
- New layout: Gives options for how many screens to show. (Minimum being 1 and Maximum being 9) To select how many screens to be shown use the grid, hover the mouse over the grid it will light up the selected cells.
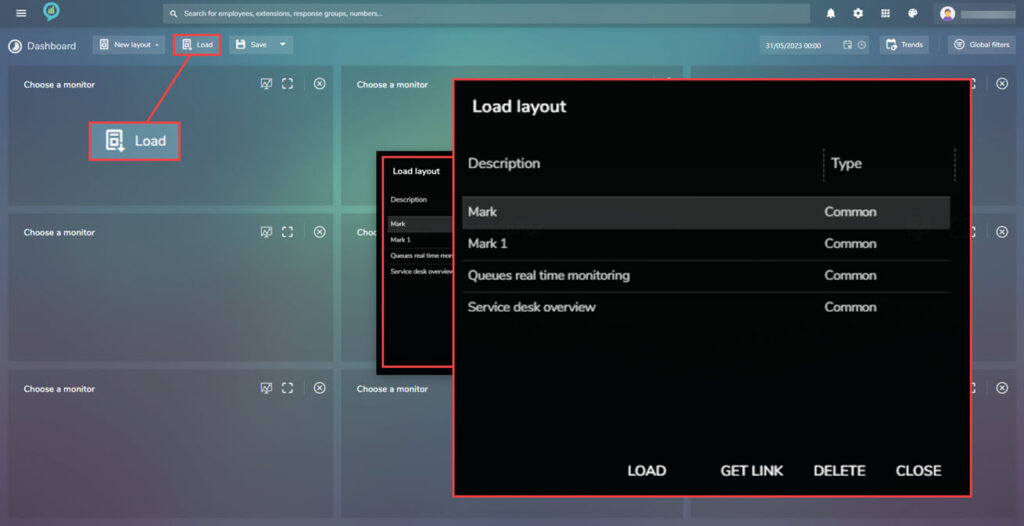
- Load: Gives a list of dashboards that are available for view. Just click on the one required and select Load (at the bottom of the pop up screen with the list)
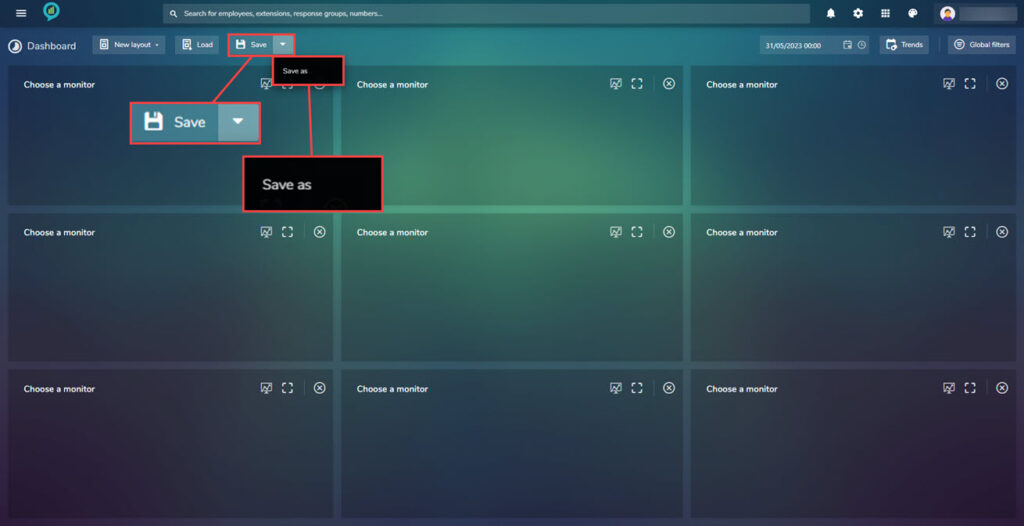
- Save: Save the current layout by clicking on here giving a description and choosing if it is a personal or shared view.
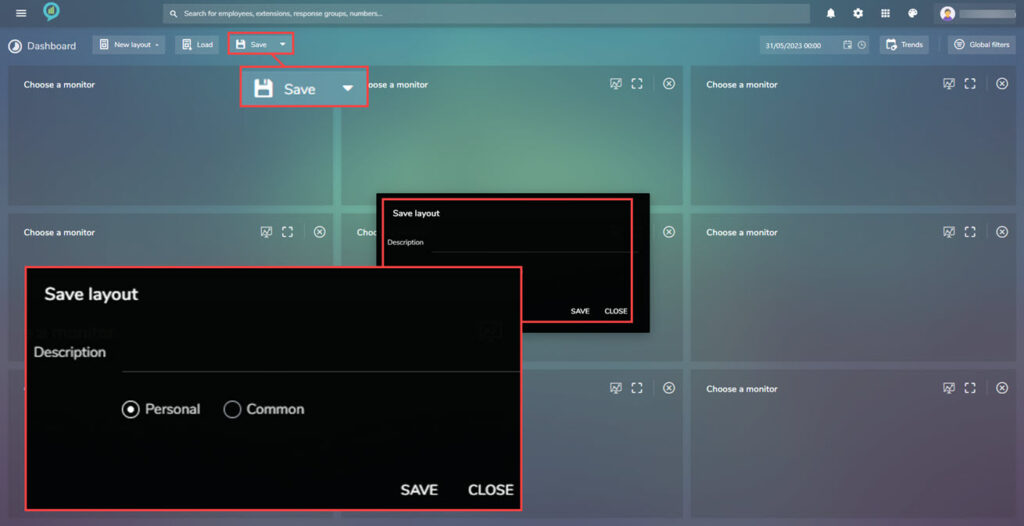
- This can also be done by clicking down arrow on the said of “save” and clicking on the “Save as” button, to the right:
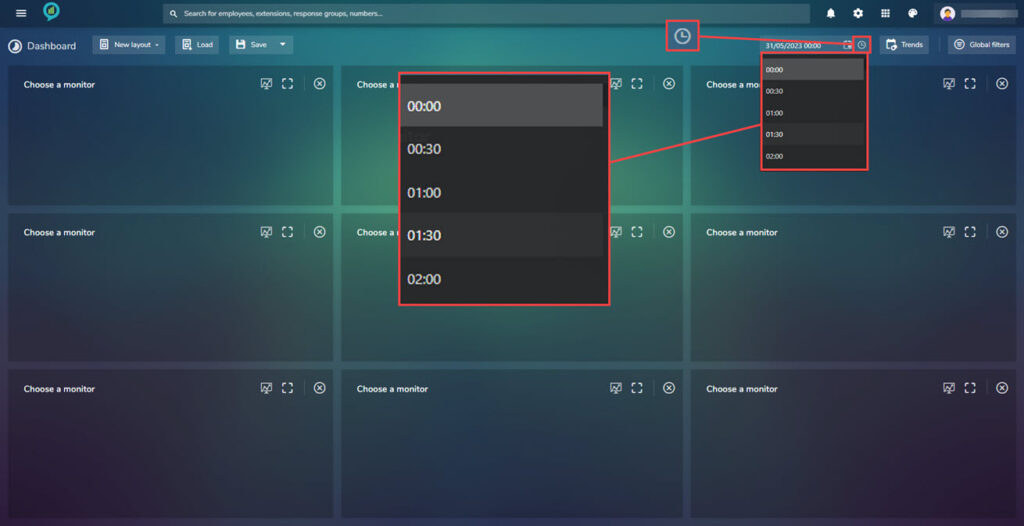
- Date: Click on the calendar icon to bring up the month view, here the < and > at the top of the calendar can be used to scroll through the months. It is also possible to type a specific date in the text box.
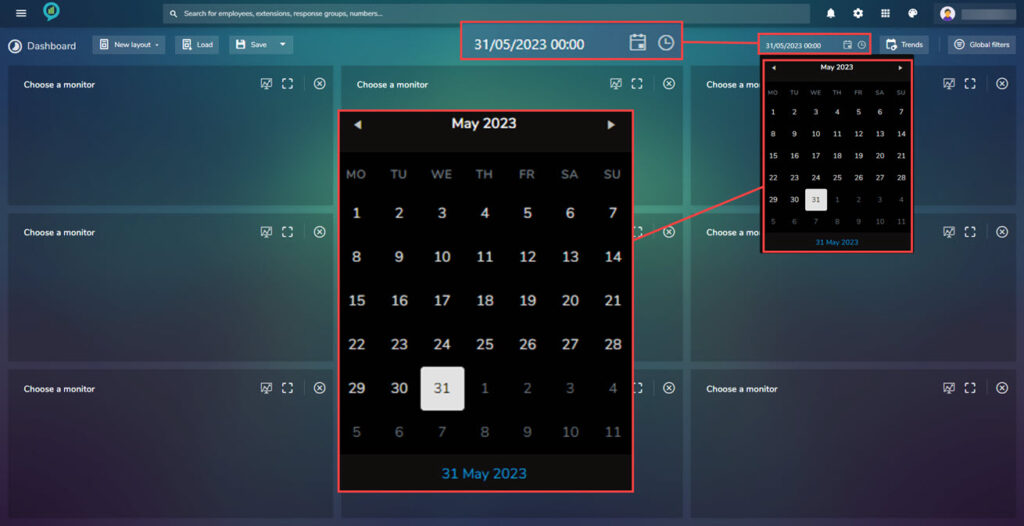
- This section also have a time option, again this can be added in the text box or a scroll menu appears when the clock icon is clicked.
- Trends: Opens another dashboard view for the current date in a new tab. This dashboard still has the menu items on the left but the right will have changed. Information in this dashboard can be customized.
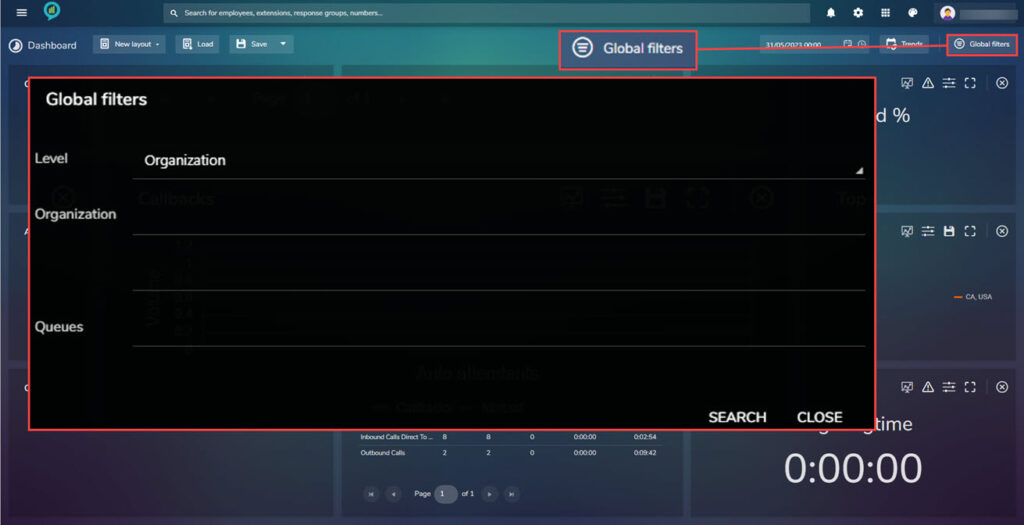
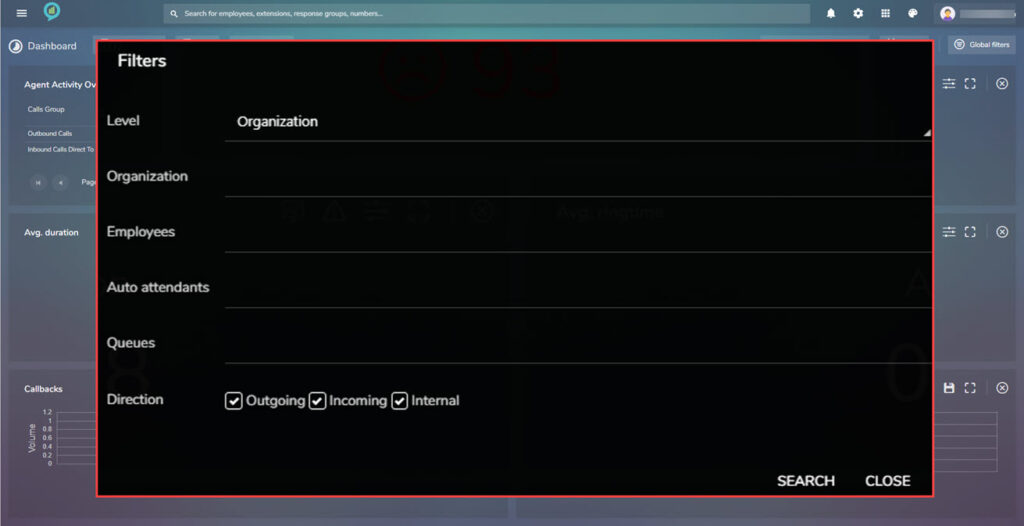
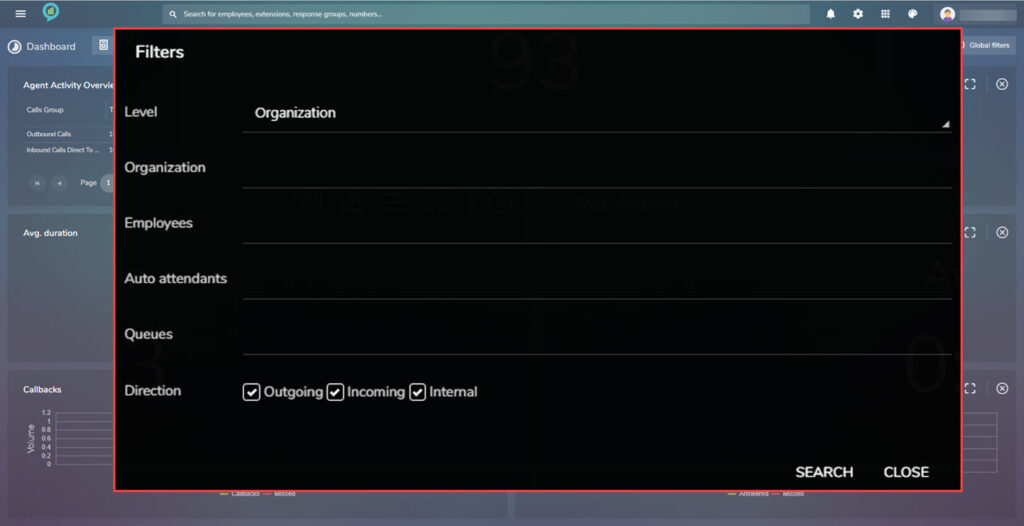
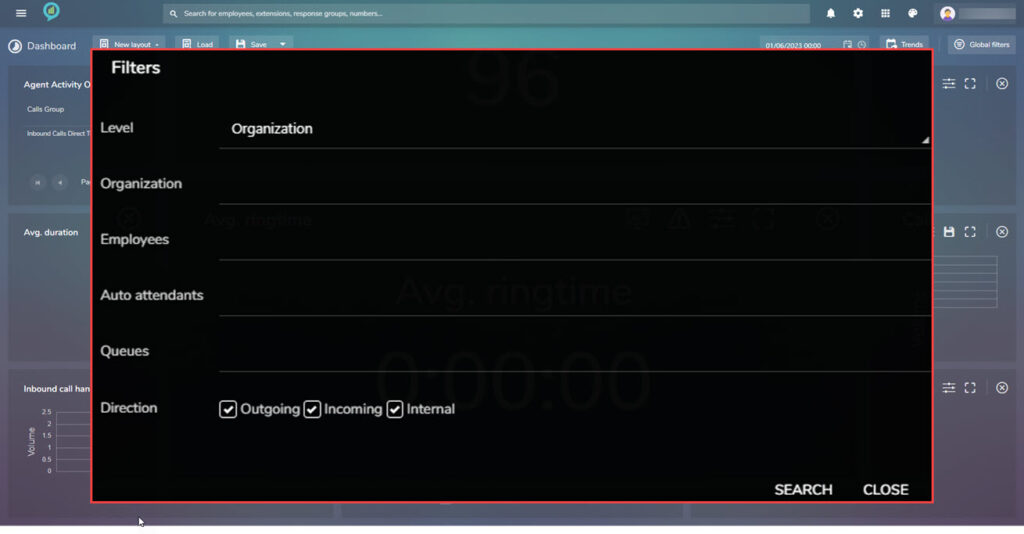
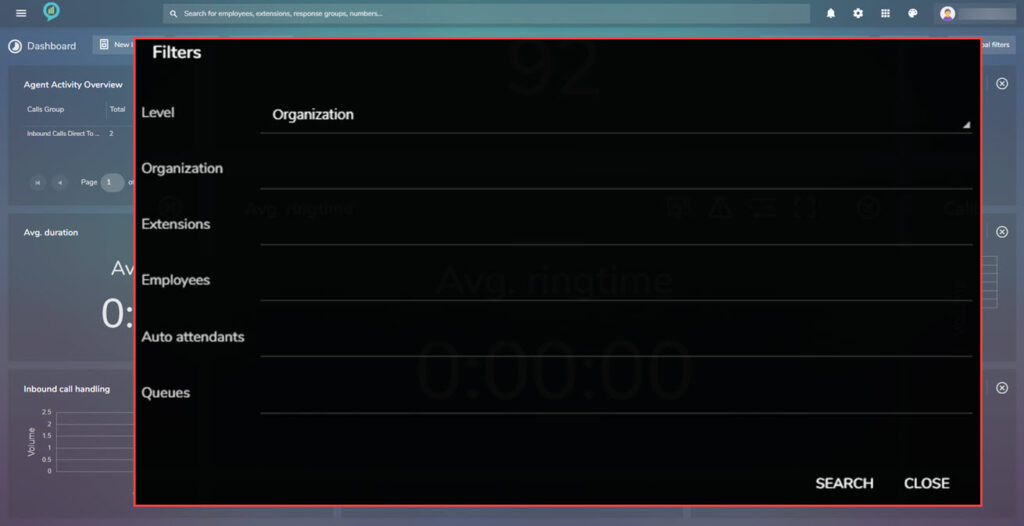
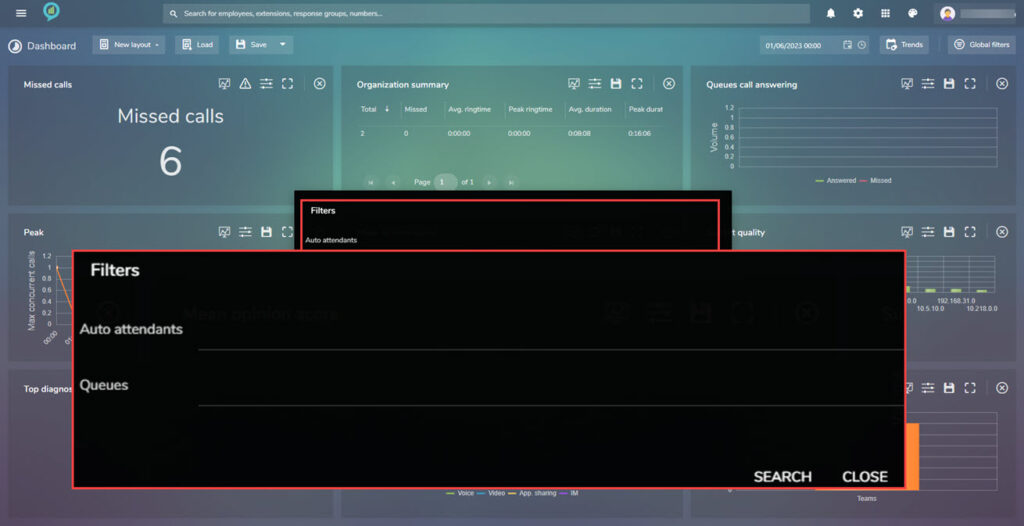
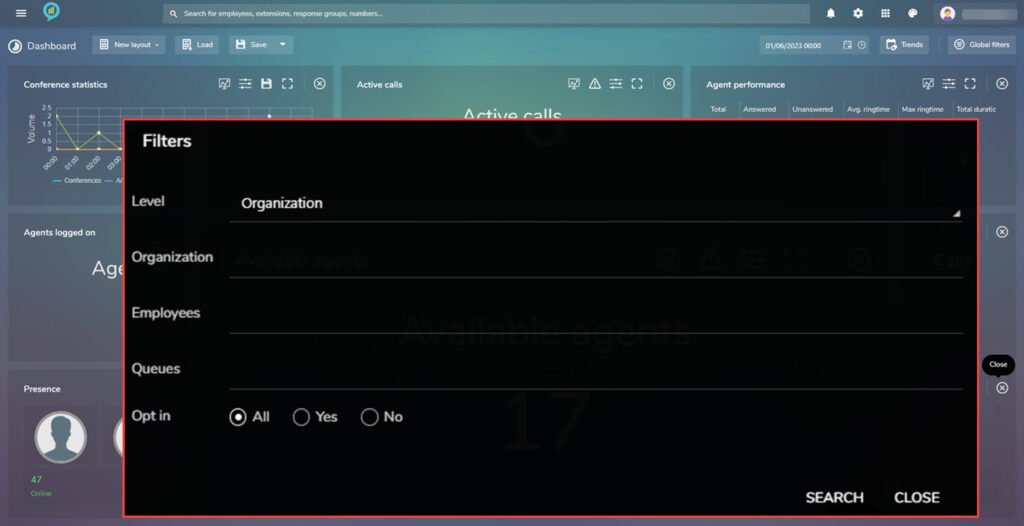
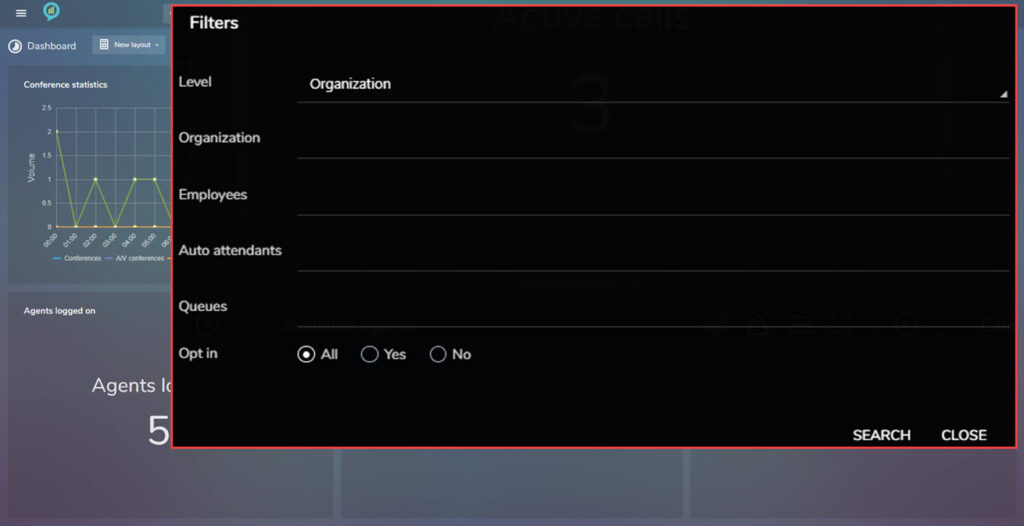
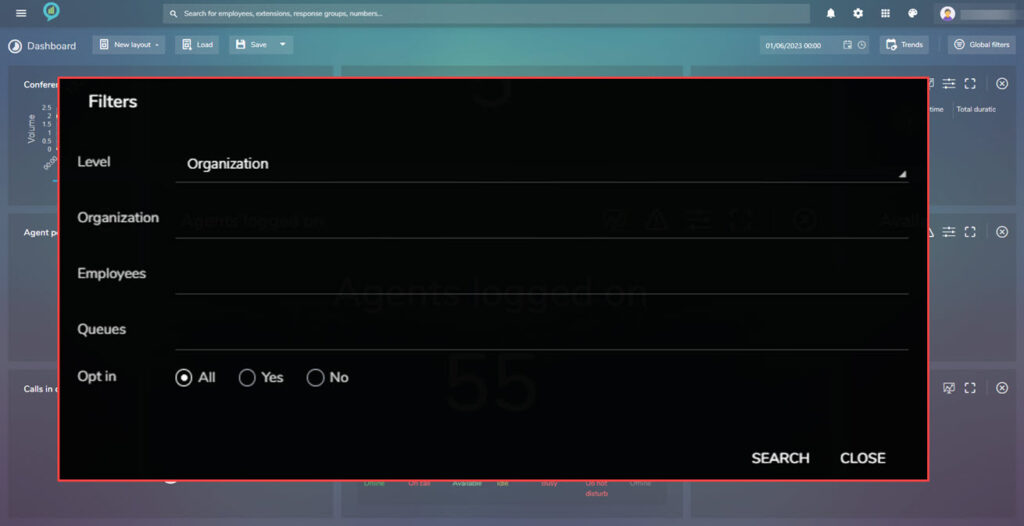
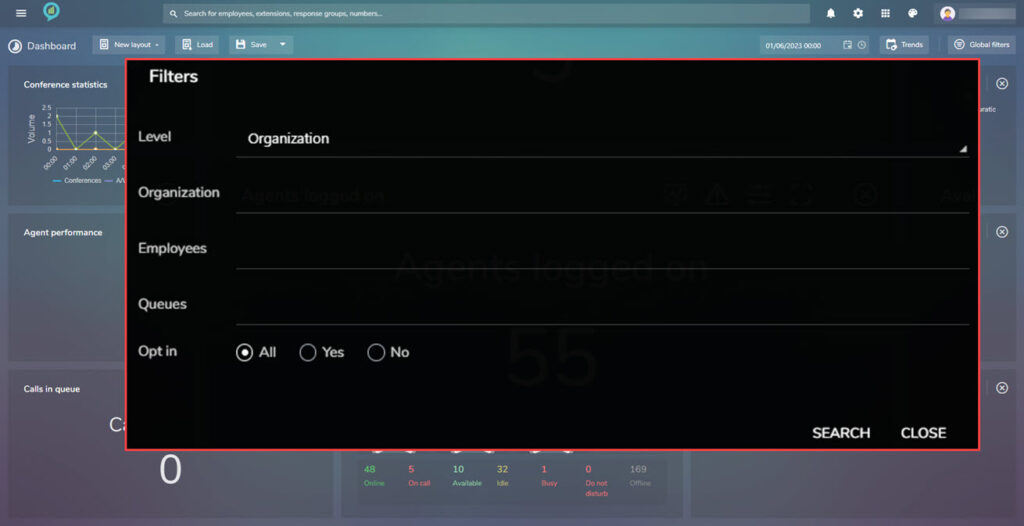
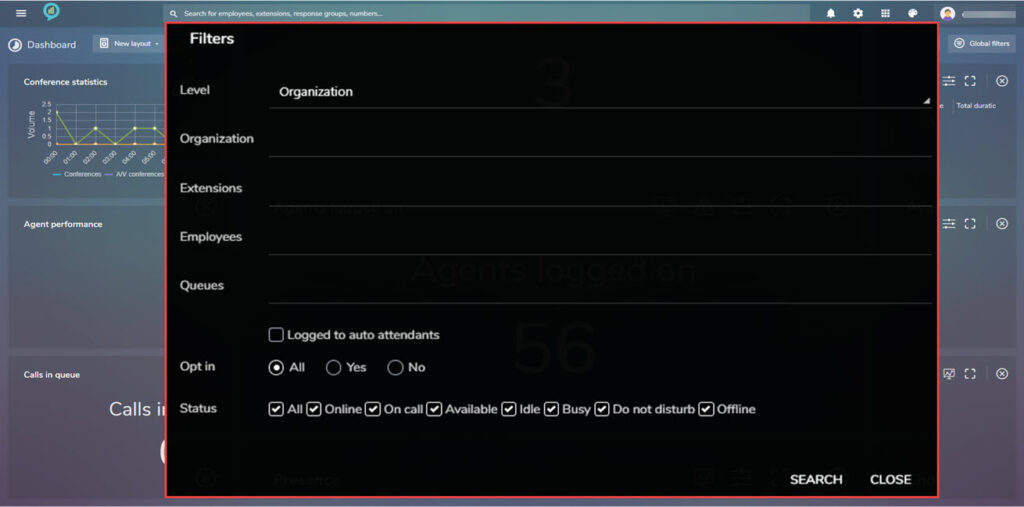
- Global Filters: Opens a new screen with the options for the global filters.
Dashboard Options
Call Details
This section shows the details of calls.
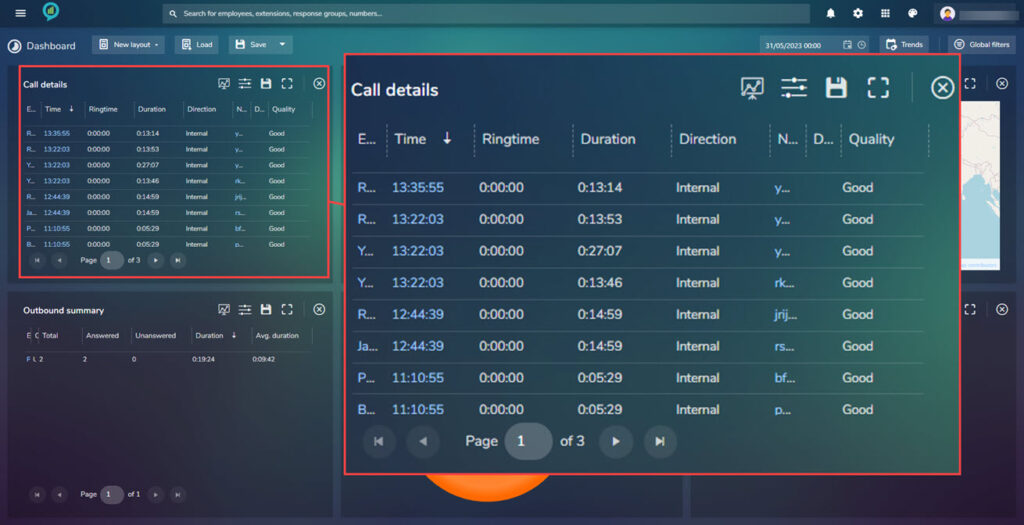
The sections are as follows from left to right:
- Employees
- Time
- Ring time
- Duration
- Direction
- Number
- Destination
- Quality
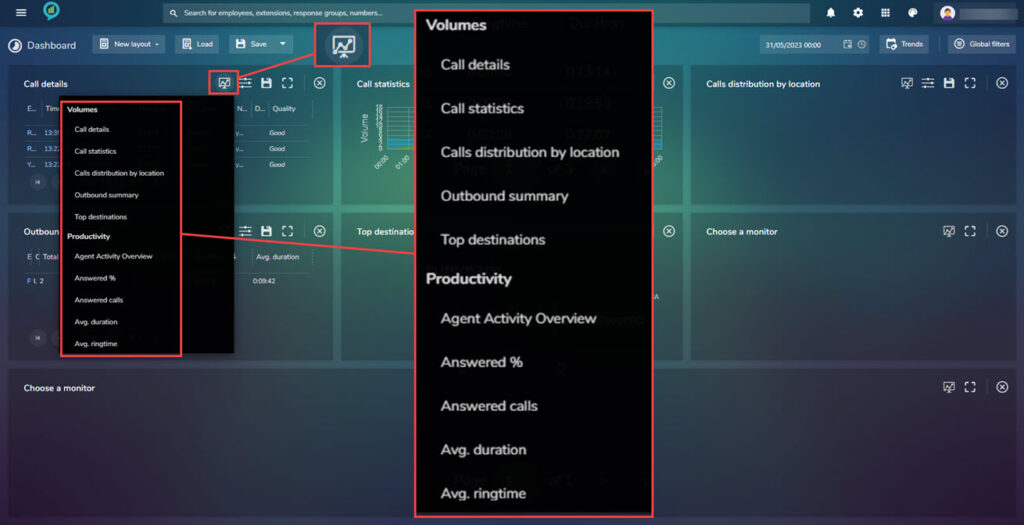
The small icons at the top of the window are mostly the same whatever the view.
The first one is the view option, this is where the view can be customized by choosing from a list of options:
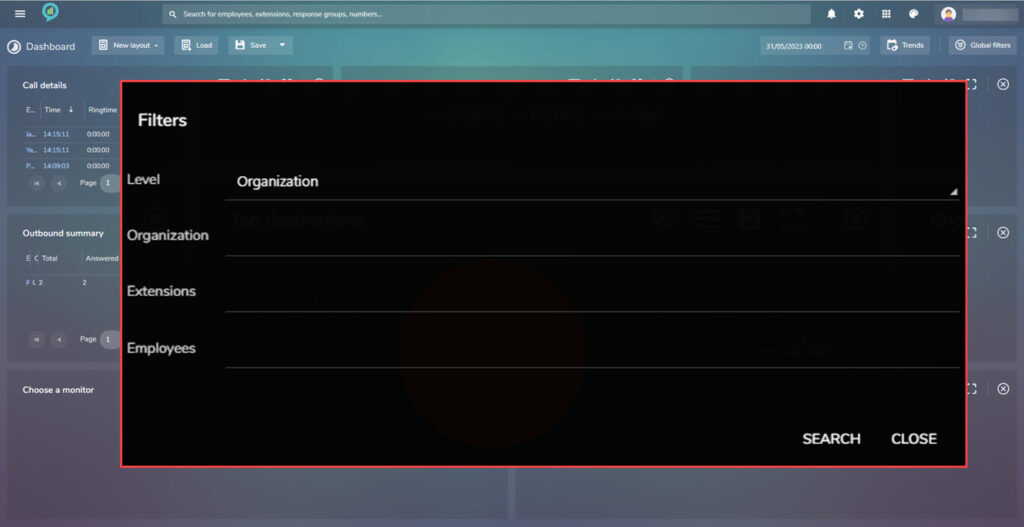
Next is the filter icon, for this option the selection of filter is as shown below:
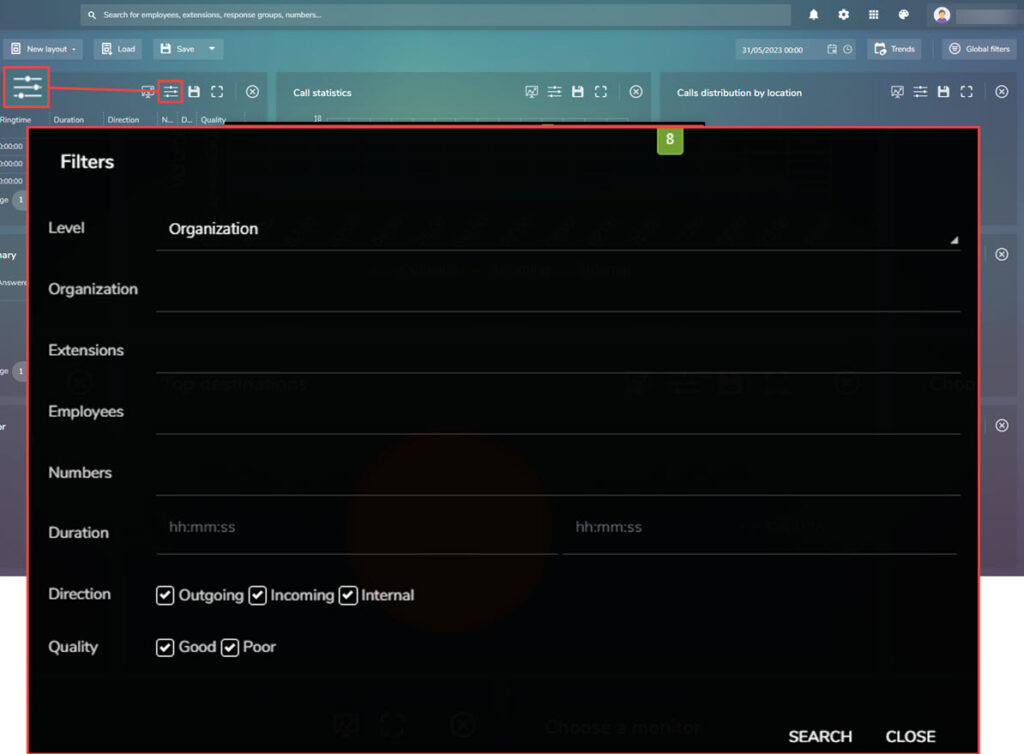
The icons following filters are as follows:
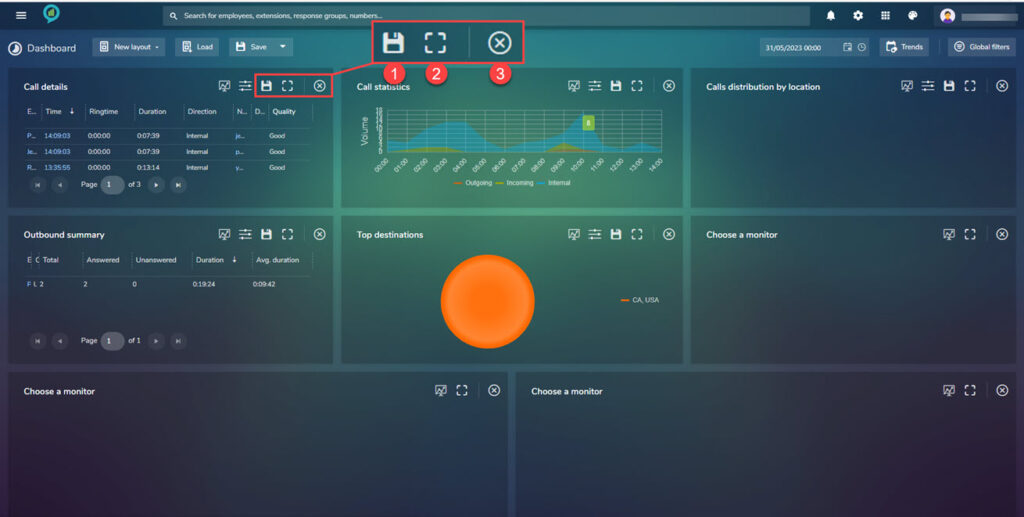
- Save
- Full screen view
- Close
Call Statistics
This shows the calls in a graph view, the coloured lines at the bottom offer the option to view the graph with less information.
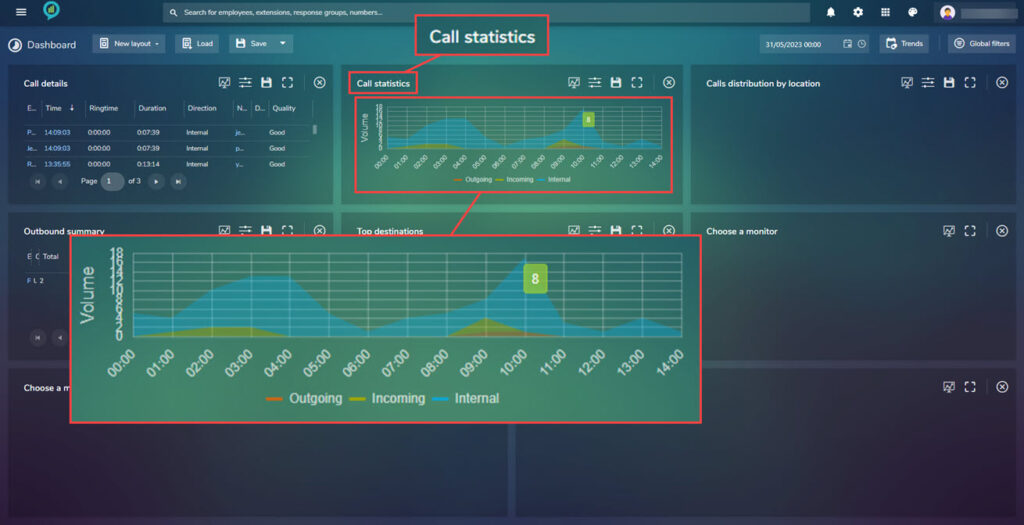
The below view shows the data without the internal calls:
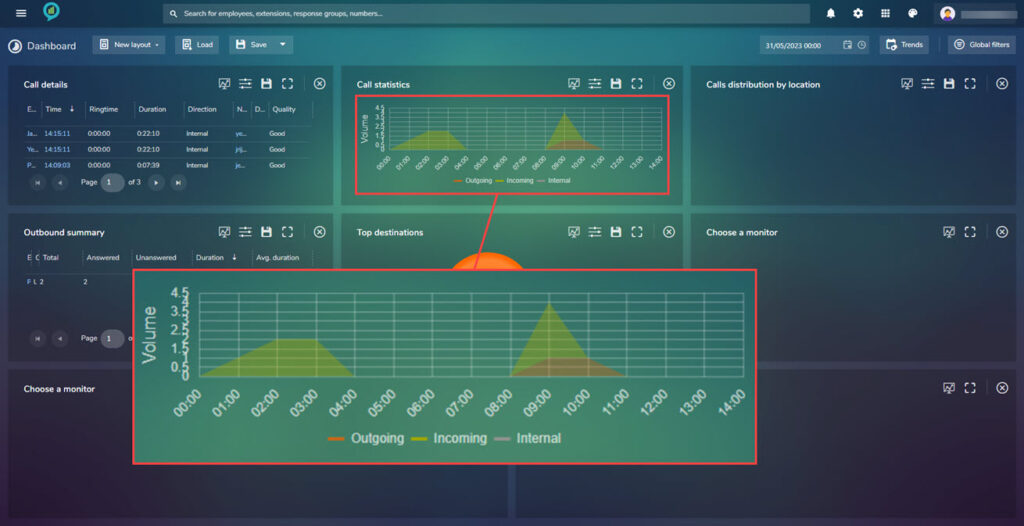
The filters for this section are shown below:
Calls Distribution by Location
This monitor shows the calls by location, the map can be clicked on and the view zoomed in to see the locations.

Filters for this option are as follows:
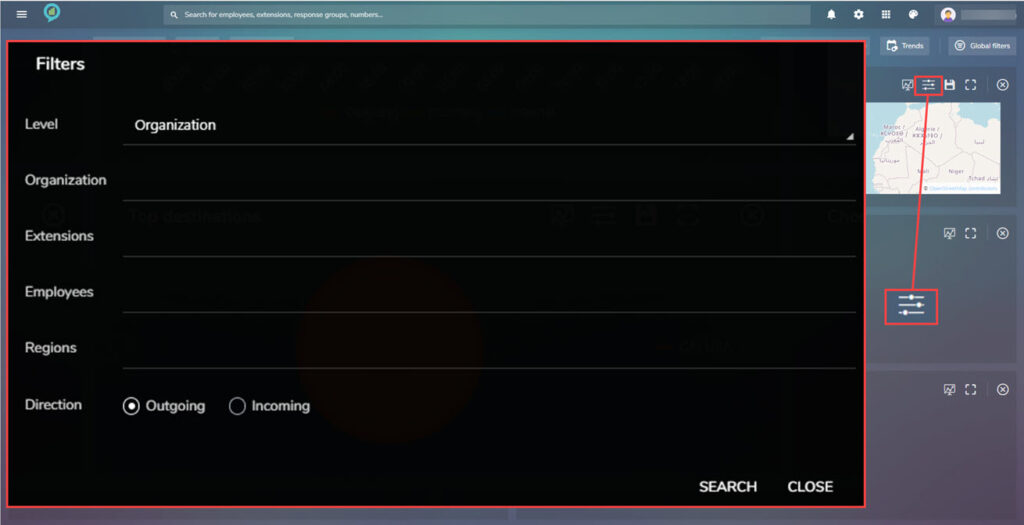
Outbound Summary
This contains details of outbound calls:
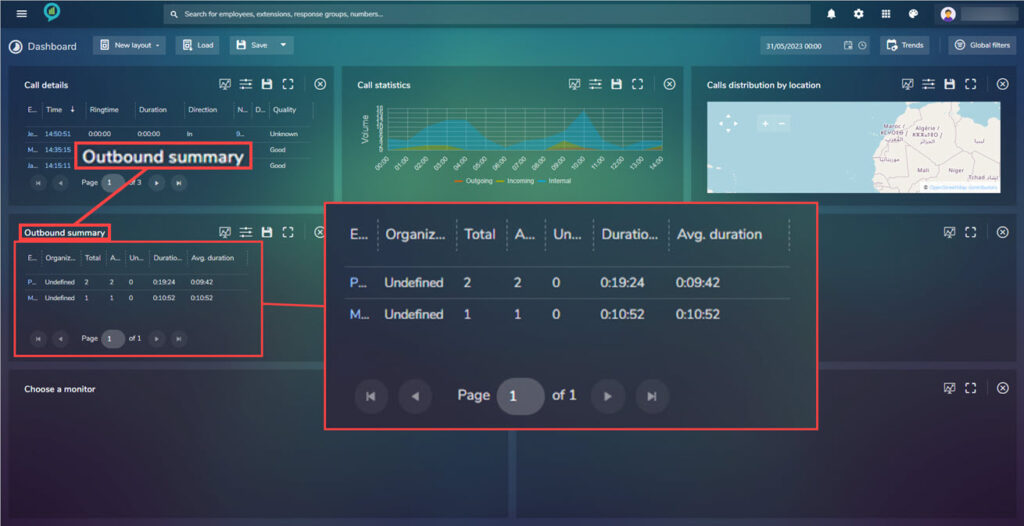
The sections here are, from left to right:
- Employee
- Organization unit
- Total
- Answered
- Unanswered
- Duration
- Avg. duration
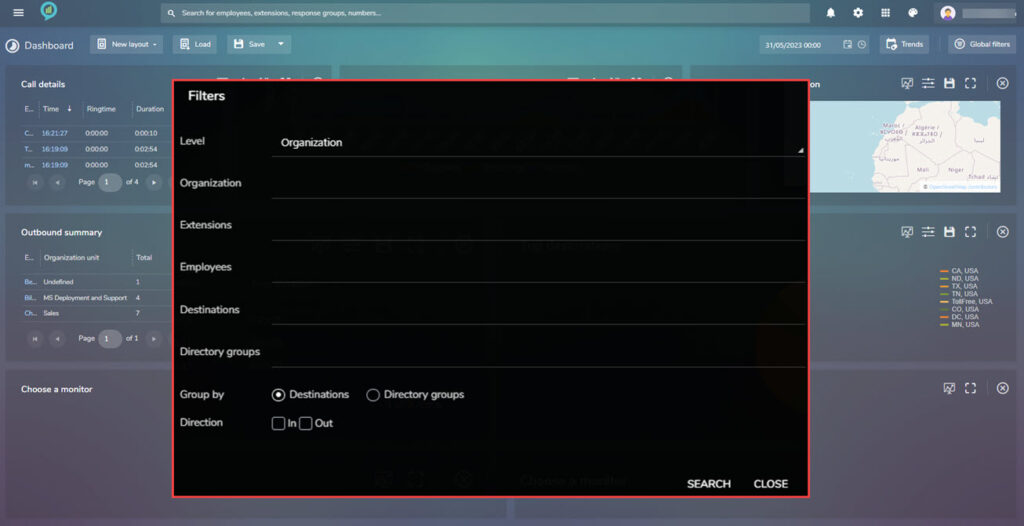
The filter button on here gives the options for:
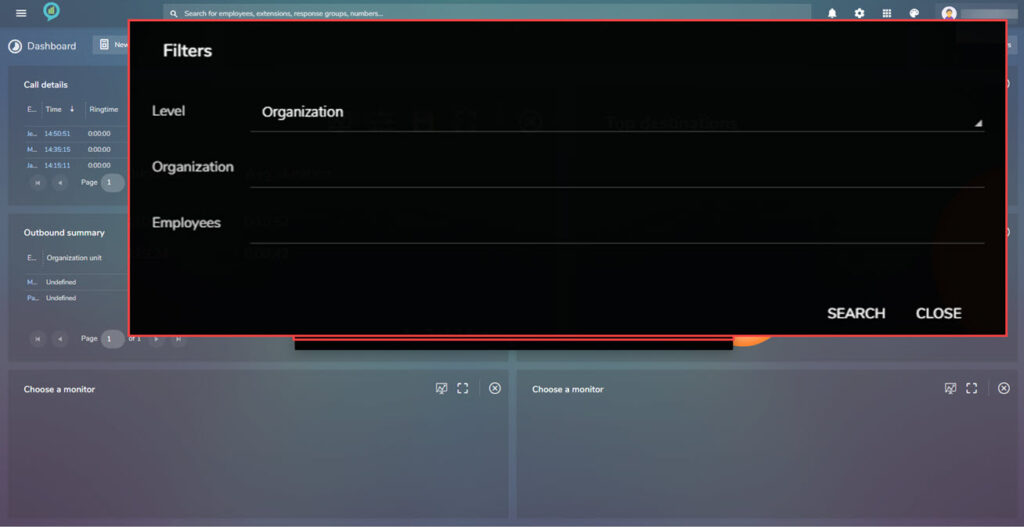
Top Destinations
Shows the information for the top destination of calls:
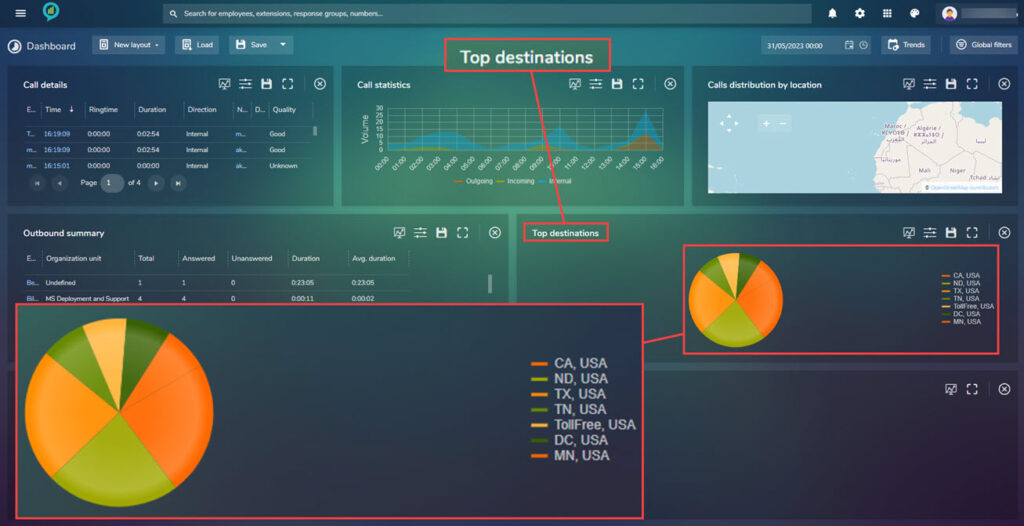
Clicking on a section from the chart will open a new window showing the information in more detail:
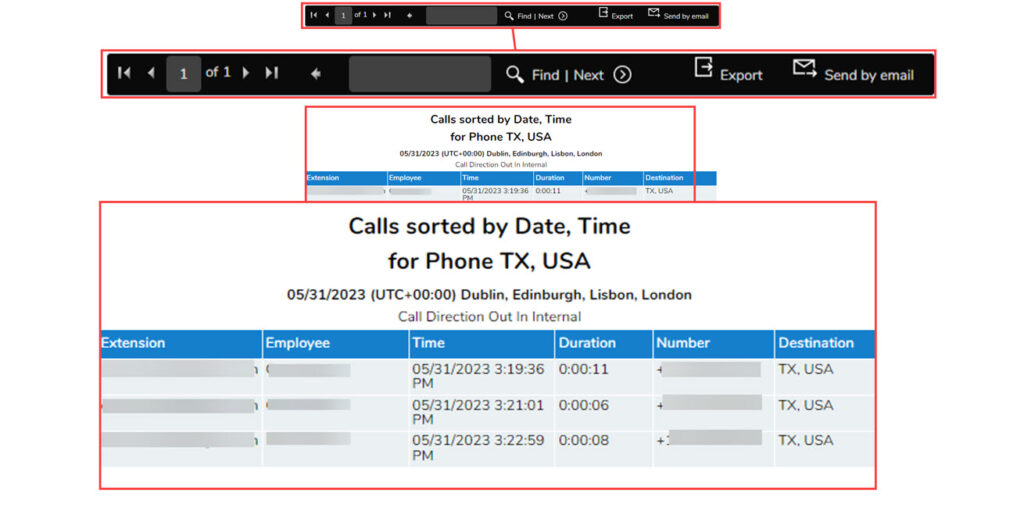
It is possible to export or email out this information by using the menu at the top of the page.
The filters for this section are:
Agent Activity Overview
This shows the outbound calls made and the inbound directly to an agent.
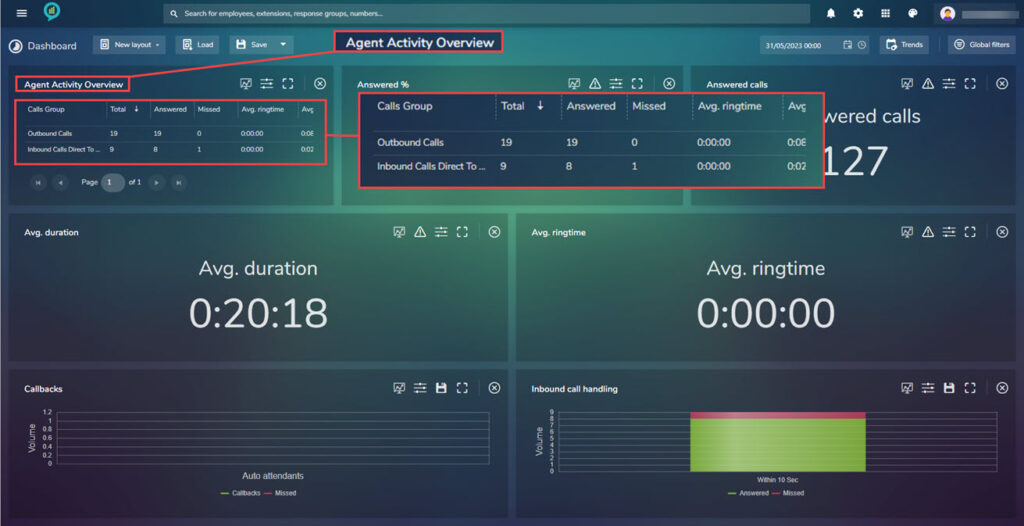
The sections for this selection are as follows reading from left to right:
- Calls Group
- Total
- Answered
- Missed
- Avg. ring time
- Avg. duration
- Total duration
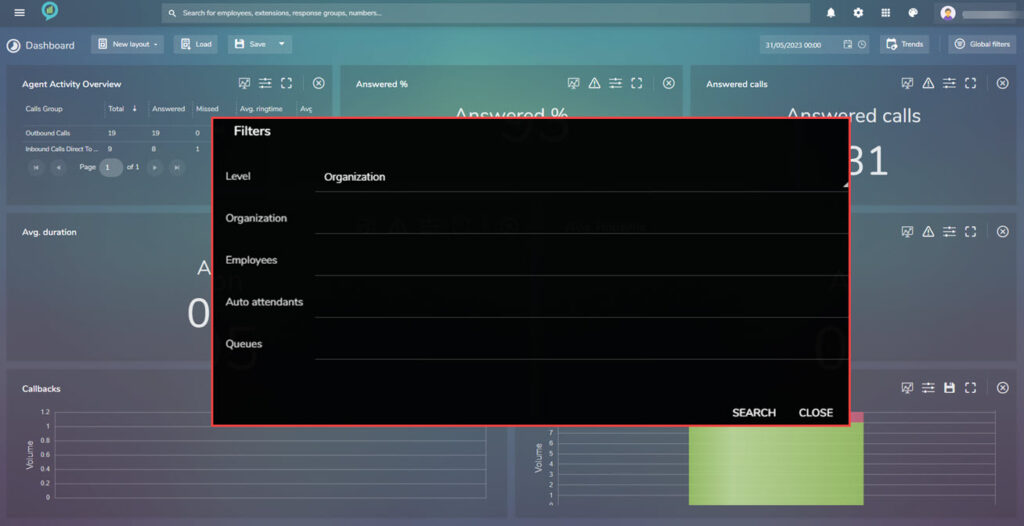
The following filters are available:
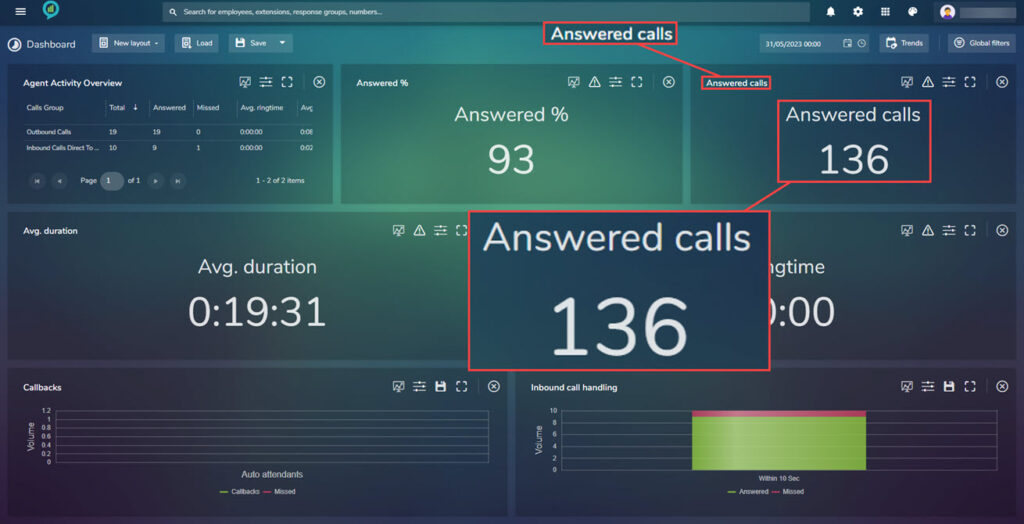
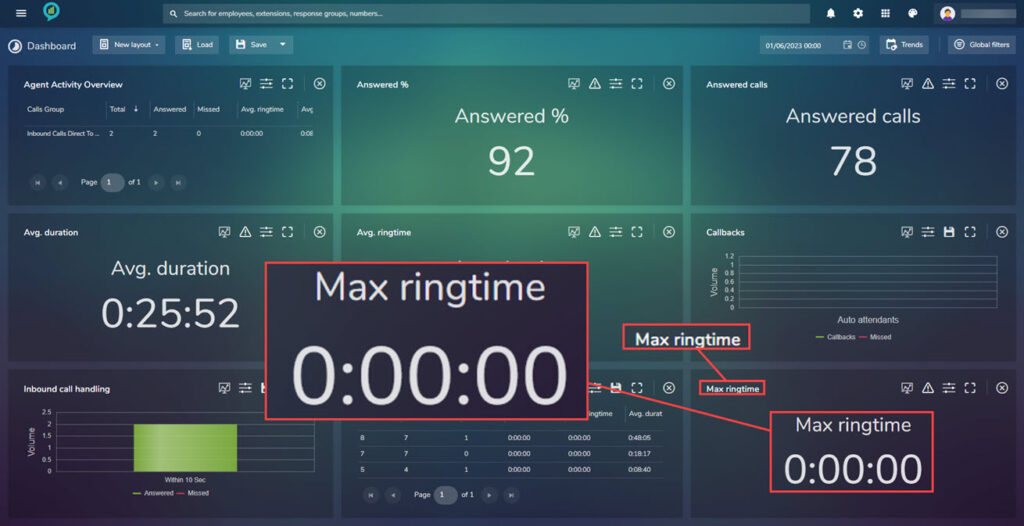
Answered %
This screen shows an overview of the percentage of calls that have been answered:
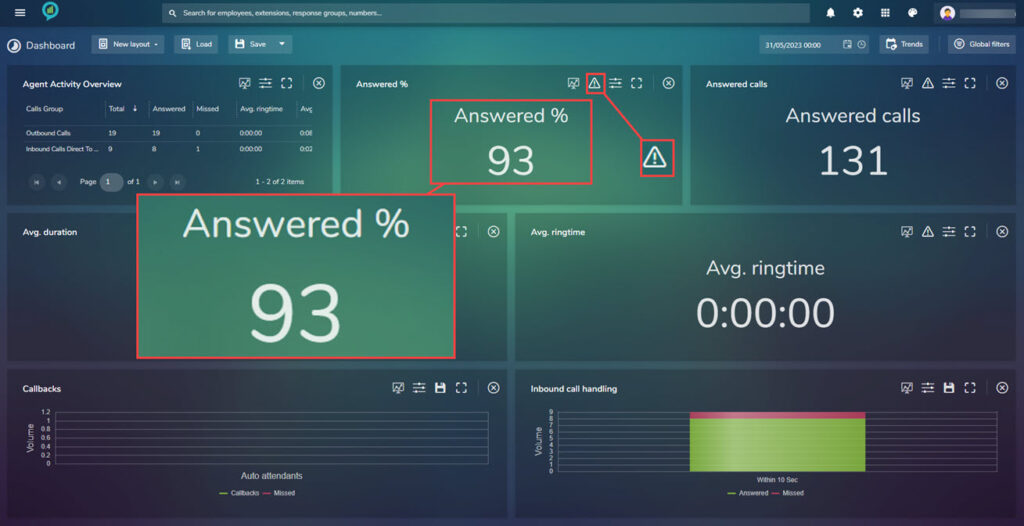
This screen has a new icon that was not on the previous reports. This is where the Thresholds are set:
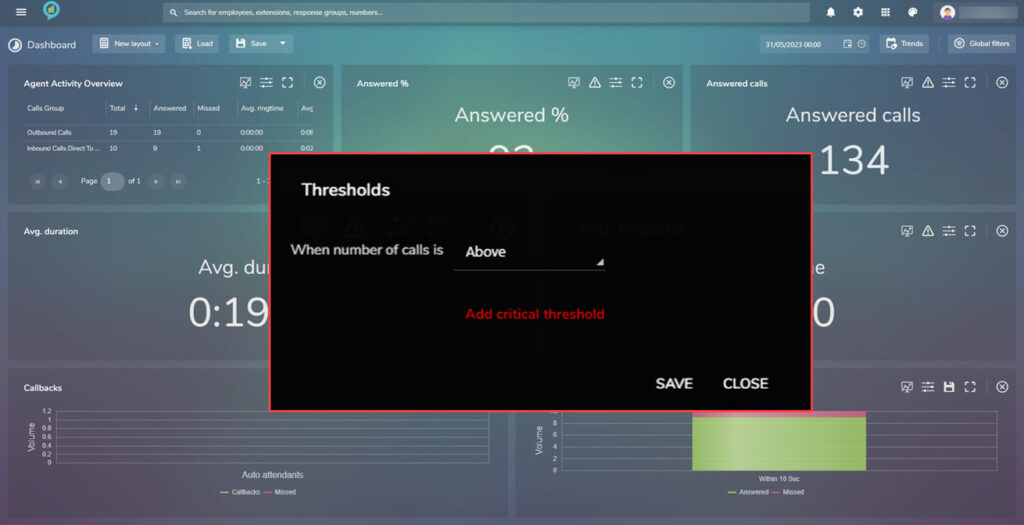
Clicking on the button opens the options for the Threshold setting, the first option here is Above or Below, clicking on add critical threshold (shown above in red text) opens further setting options:
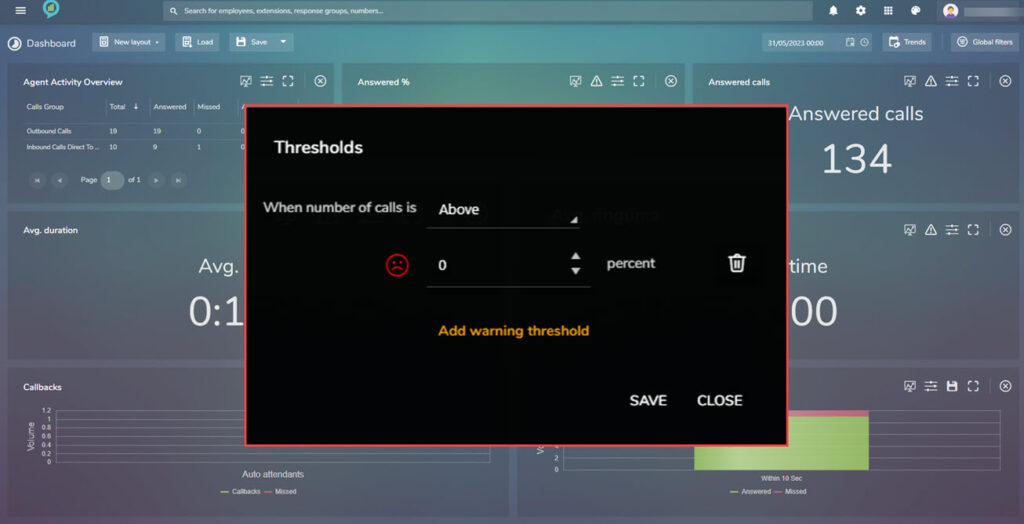
Choose the percentage then click on the add warning threshold (in orange text) to view the last option:
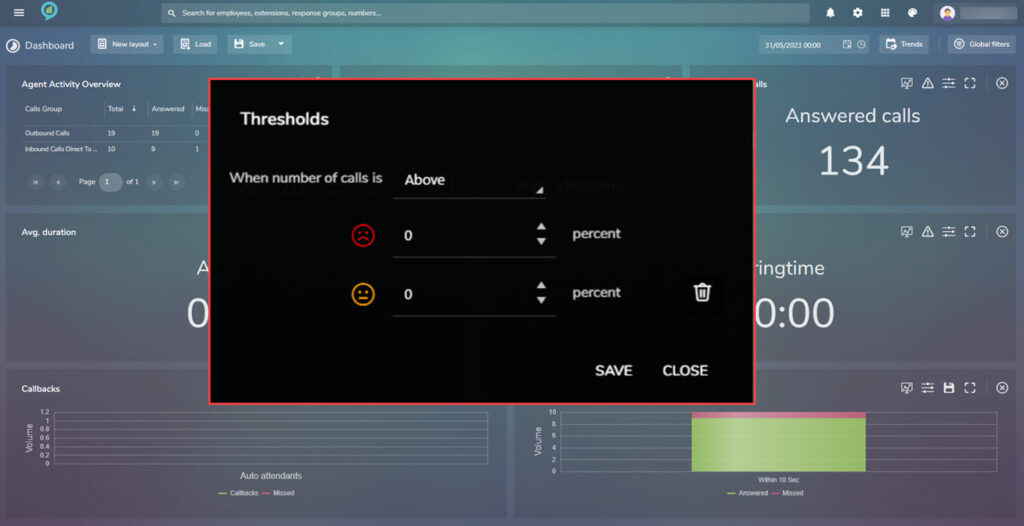
Once this is set, click on save to action the settings.
The available filters for this section are as below:
Answered Calls
Unlike the above this shows an actual number of answered calls:
The threshold settings for this section are as before and the filters are:
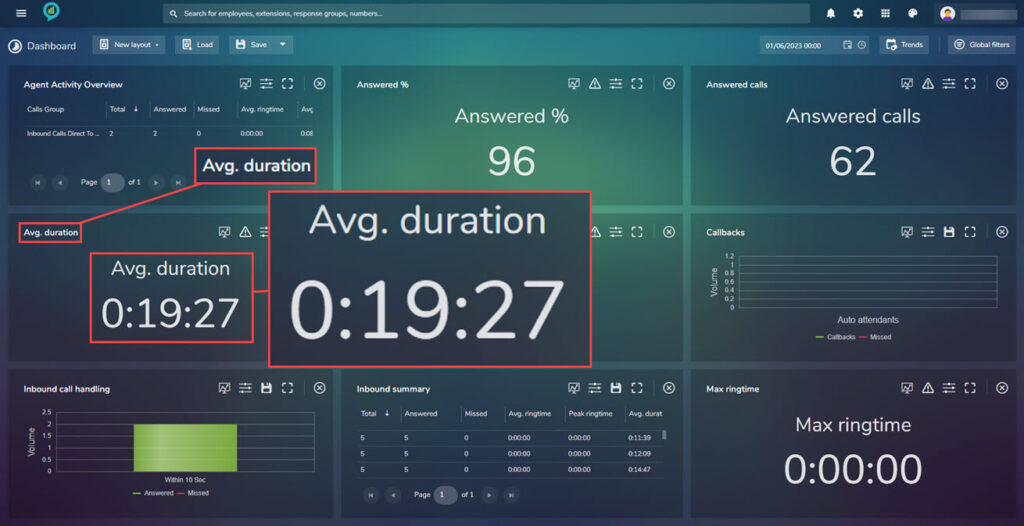
Avg. Duration
Displayed here is the average duration of calls:
Again Thresholds can be set in the same way as the Answered %. The filters available are:

Avg. Ring Time
This shows the average ring time of calls:
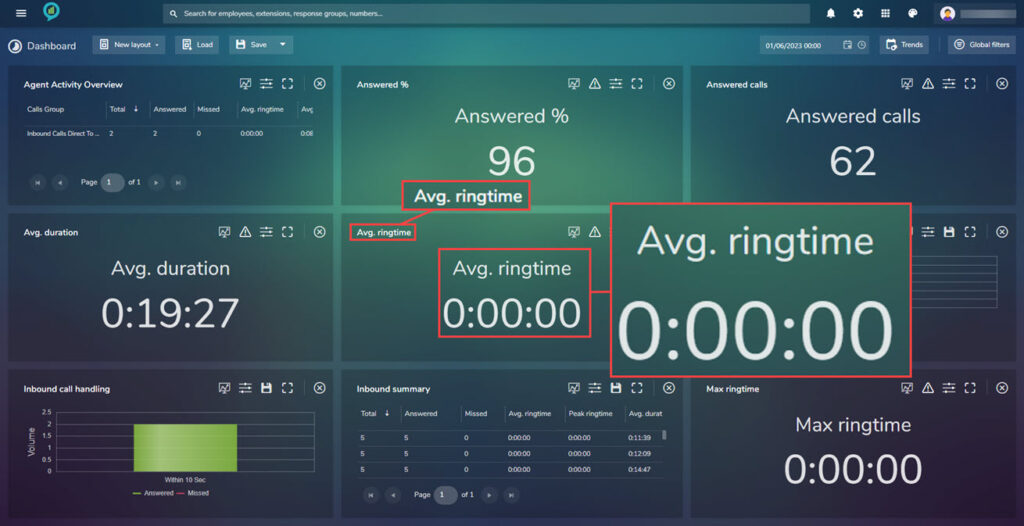
The threshold can again be set as before in here and the available filters are:
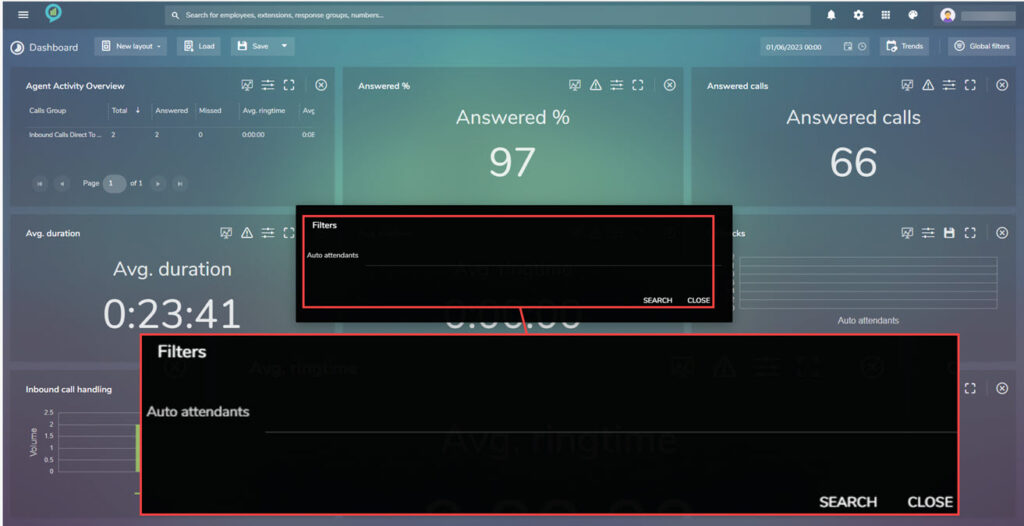
Call Backs
If using call backs these can be monitored here:
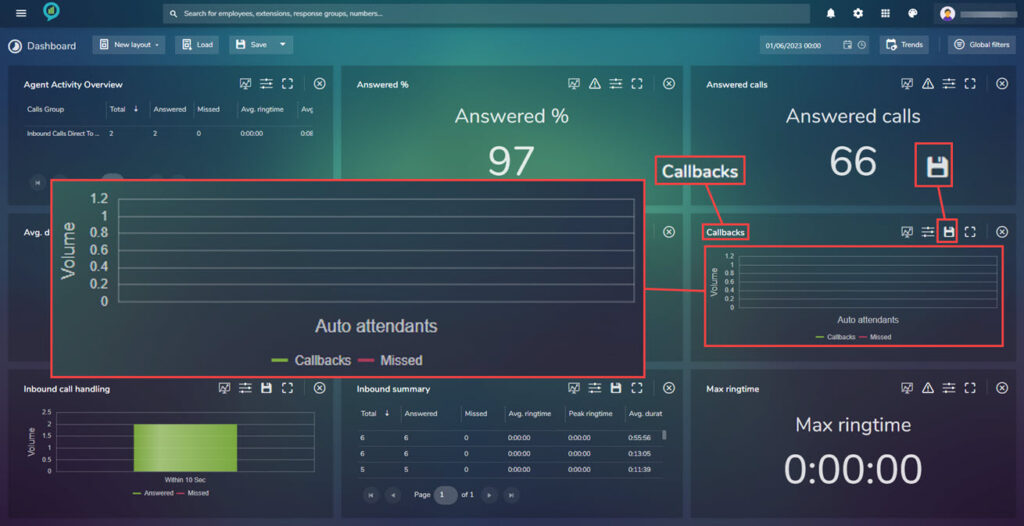
The data view can be altered to show either call backs or missed calls or both, just click the lines (red or green) to change the selection. There is also a save icon available as shown above.
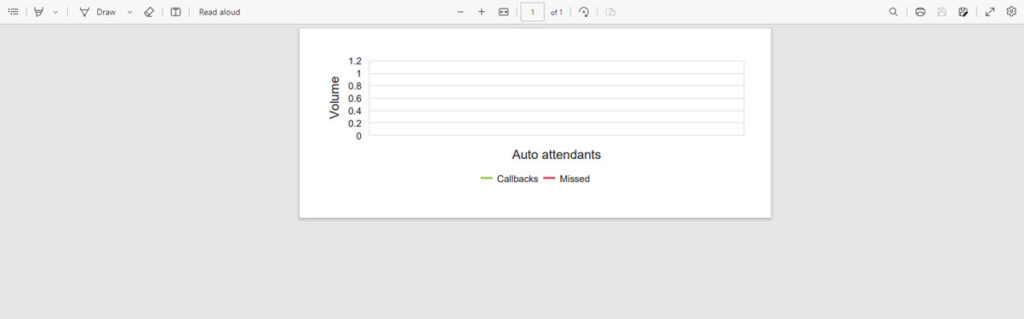
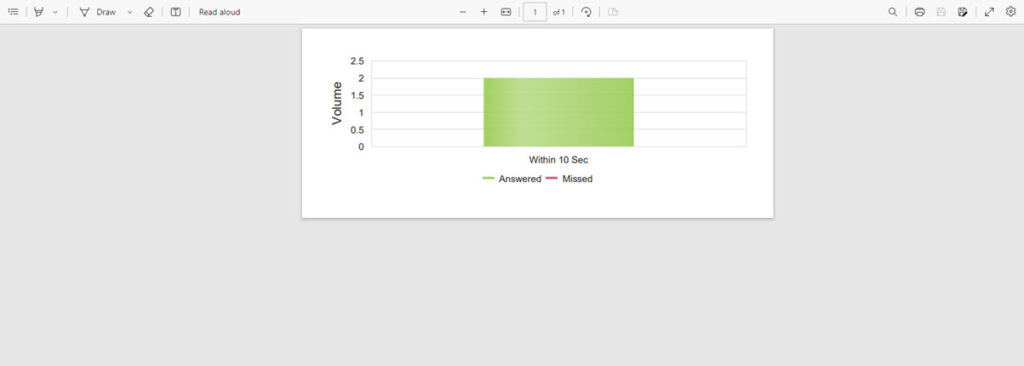
Clicking on the Save icon will Download a Chart.pdf. Click the file and it will open in a PDF:
The filters for this will allow the user to select the Auto Attendant to use for the information:
Inbound Call Handling
This view shows the total call volumes handled within a ring time. This is set as a default to include both answered and missed calls. This can be changed by click on either the Answered or Missed under the chart, filters can be applied directly on the dashboard for the following::
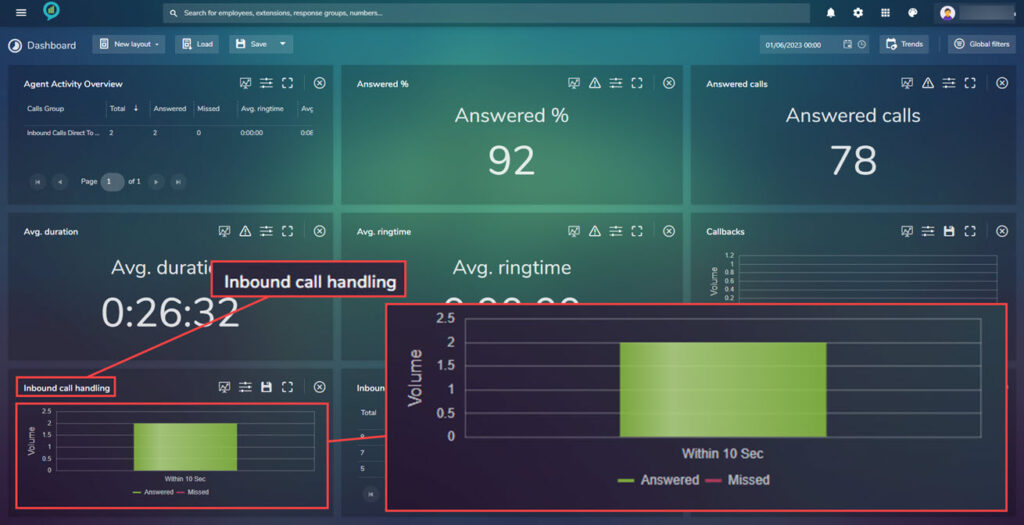
Clicking on the Save icon here downloads a Chart.pdf, open the file to view as before:
The available filters for this view are:
Inbound Summary
This screen gives the break down of the inbound calls:
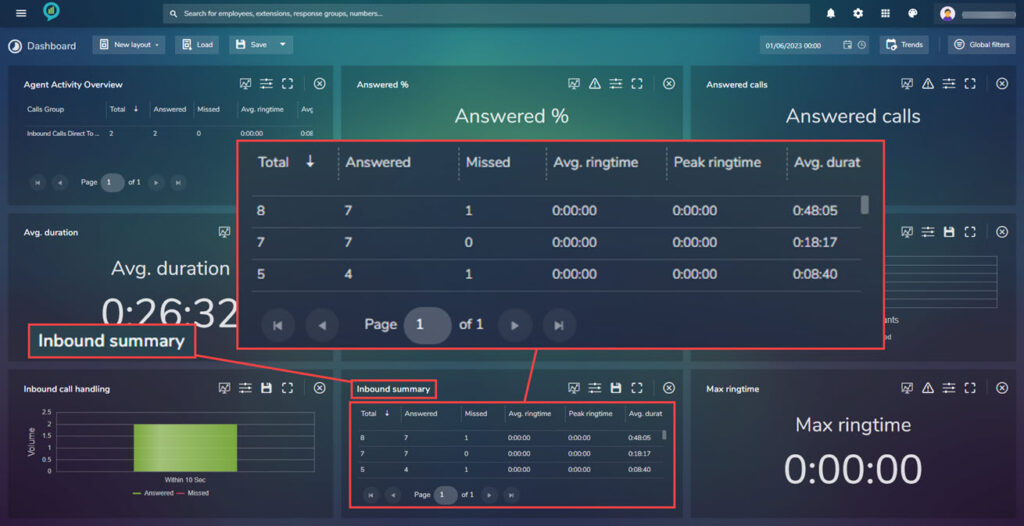
The sections here are:
- Employee
- Total
- Answered
- Missed
- Avg. ring time
- Peak ring time
- Avg. ring time
- Avg. duration
- Peak duration
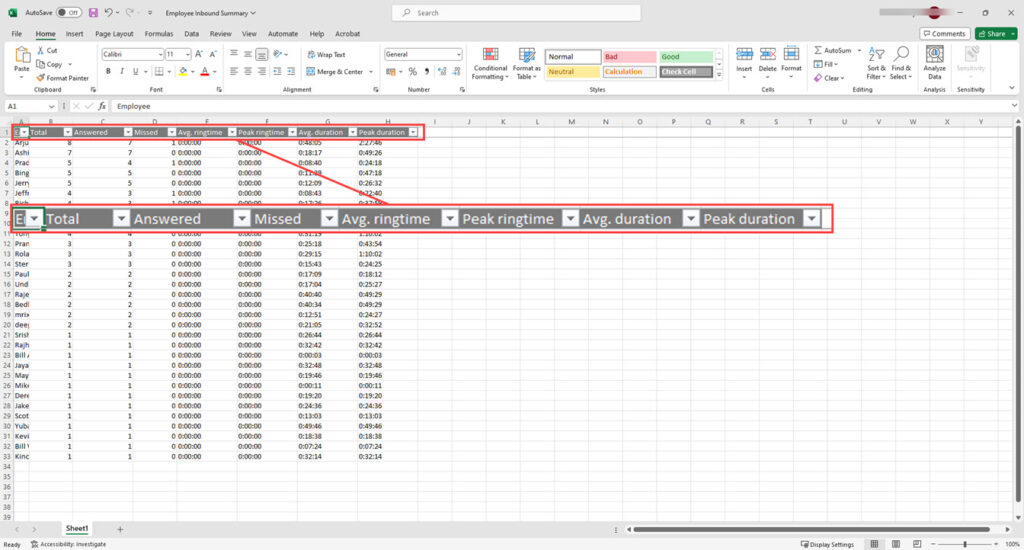
Clicking the save icon downloads a Summary.xlsx file, click on the file to view:
The filter options are:

Max Ringtime
This gives a view of the maximum ring time this can be set using the Threshold settings as detailed earlier:
The available filters are:

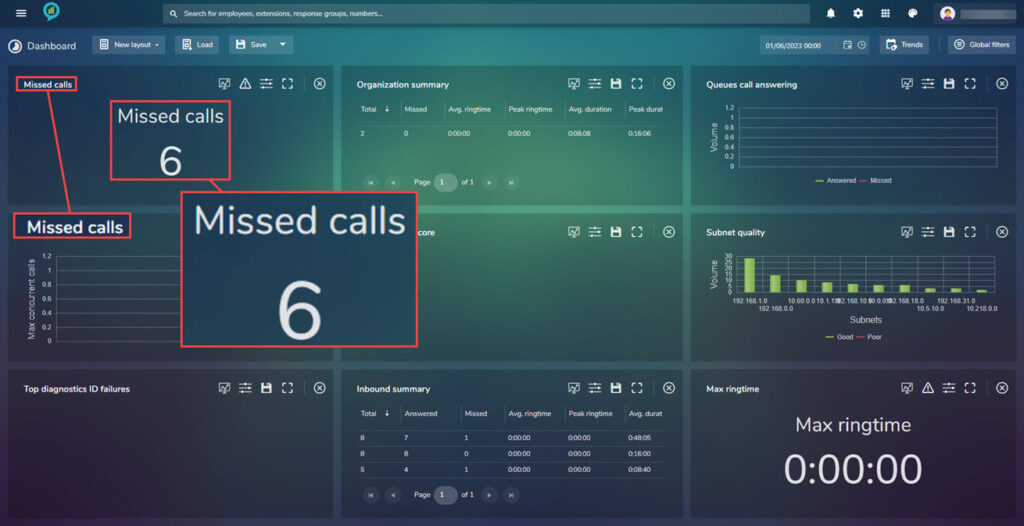
Missed Calls
This view shows the number of missed calls and can be customized using the Tolerance setting (as previously described):
The filters for this selection are as follows:

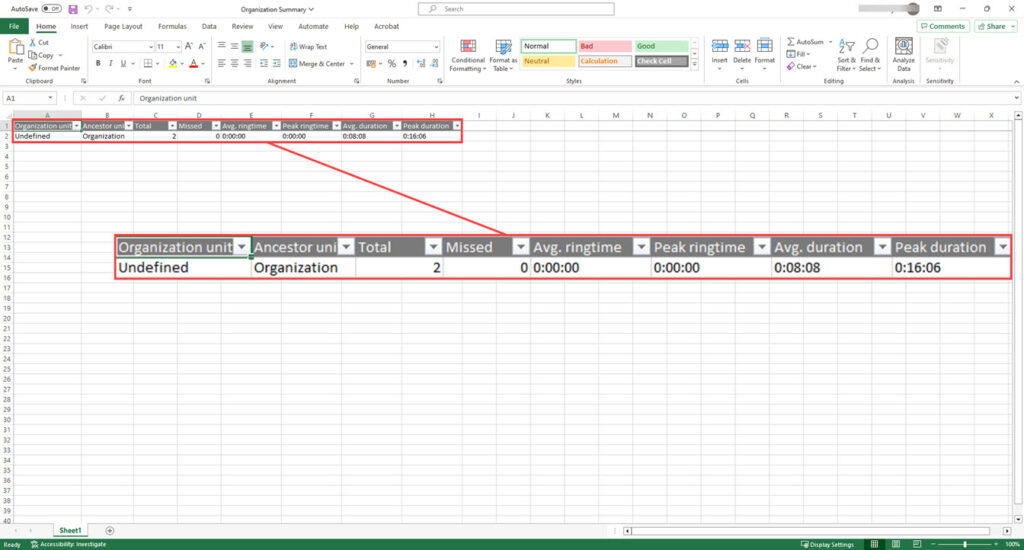
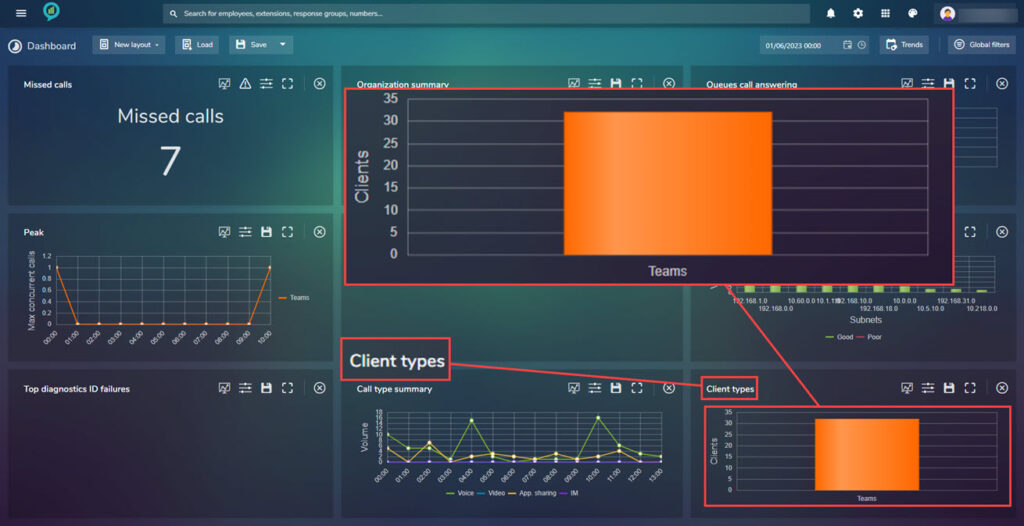
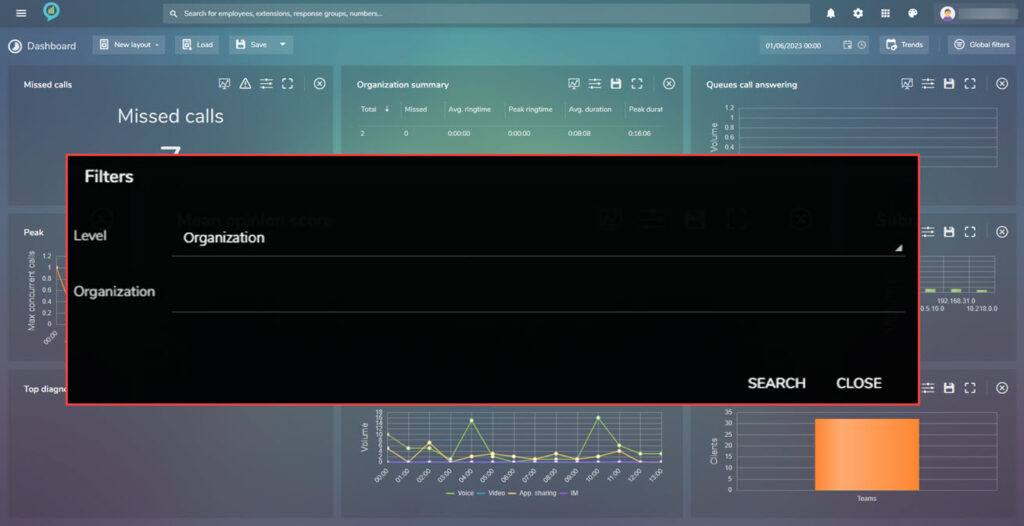
Organization Summary
This section will show the information broken down by organization unit:
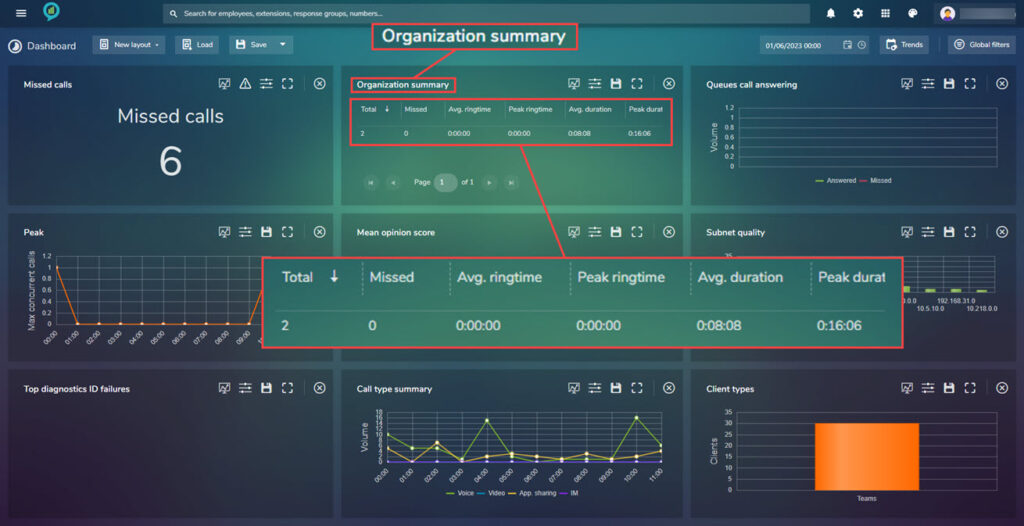
There is an option to save the file, click the save icon then an organization Summary.xlsx will be downloaded. Open to view:
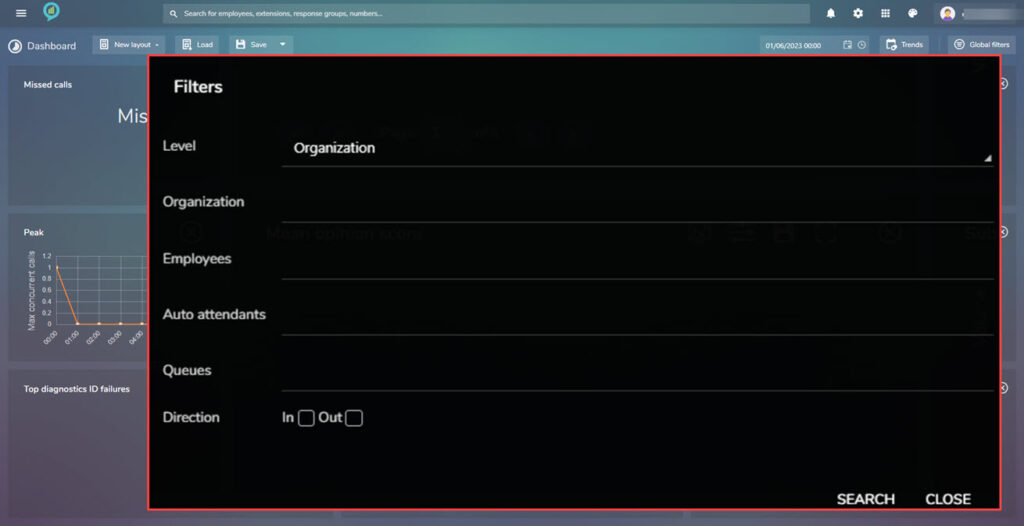
The available filters are:
Queues Call Answering
If queues are set up the data for the answered/missed calls for the queues appears in this view:
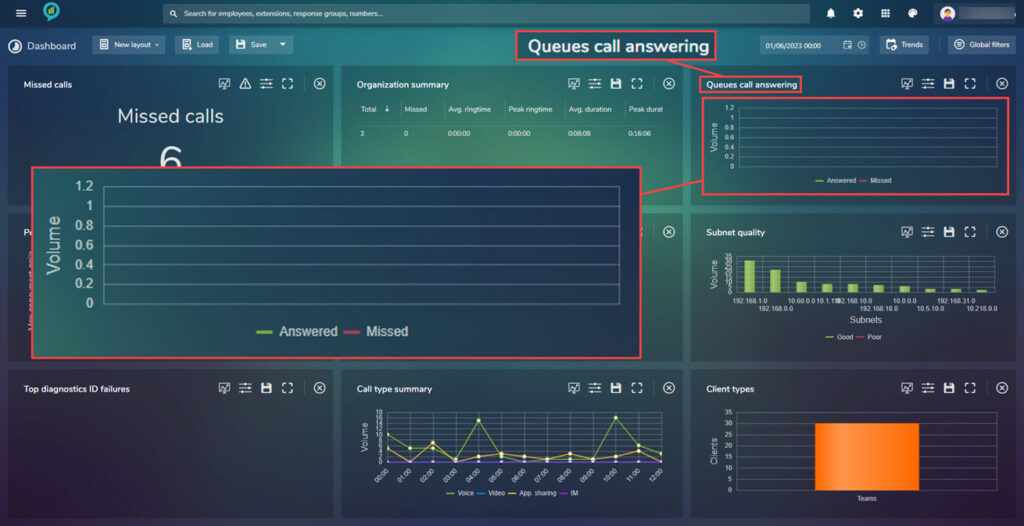
Saving this view will download a Chart.pdf. Open this to view and share:
The filters available for this are as below:
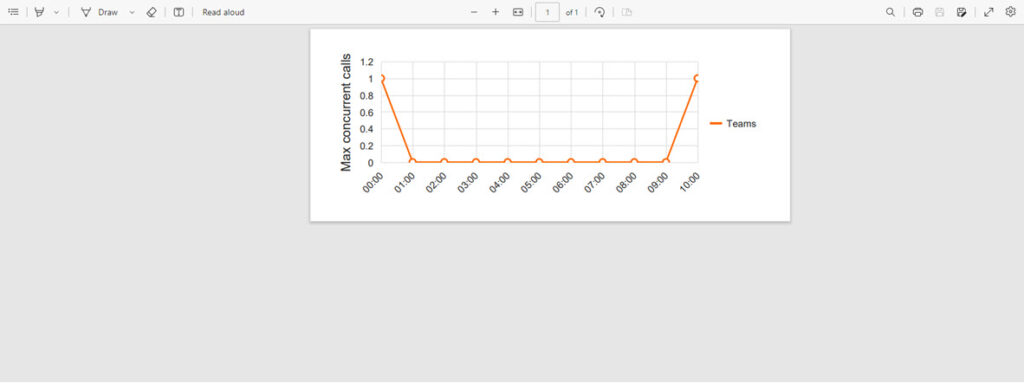
Peak
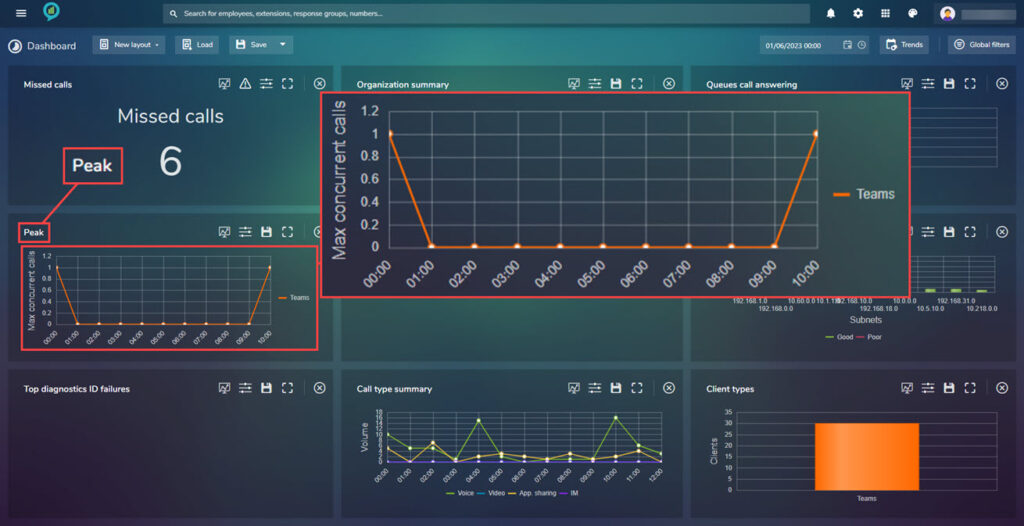
Saving this view downloads a PDF file. Open the file to see the following:
Mean Opinion Score
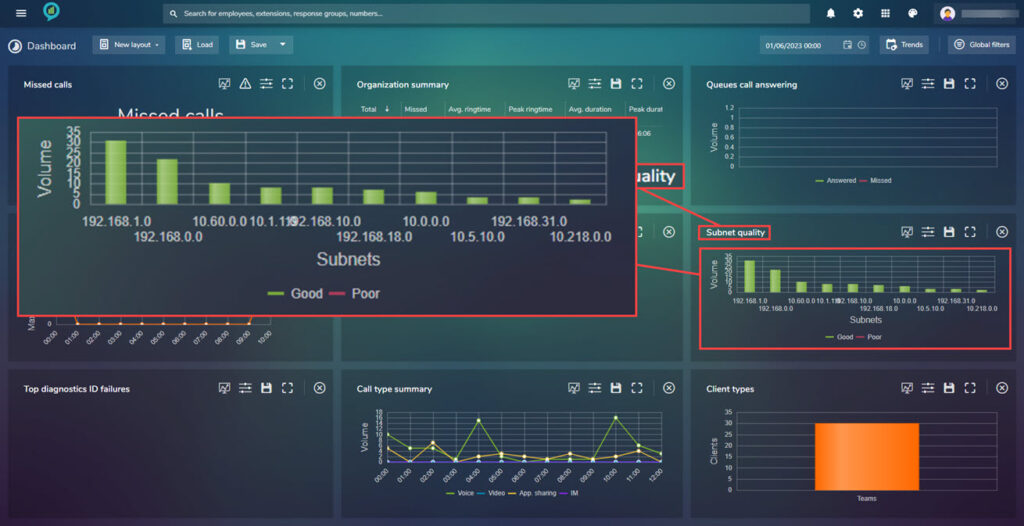
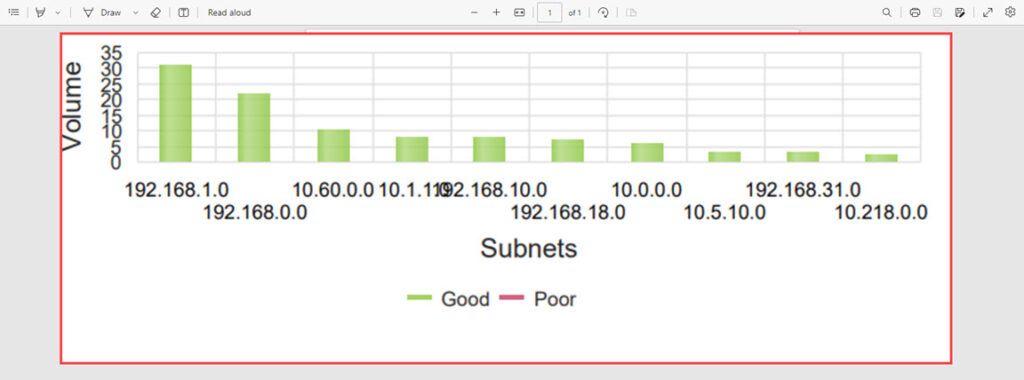
Subnet Quality
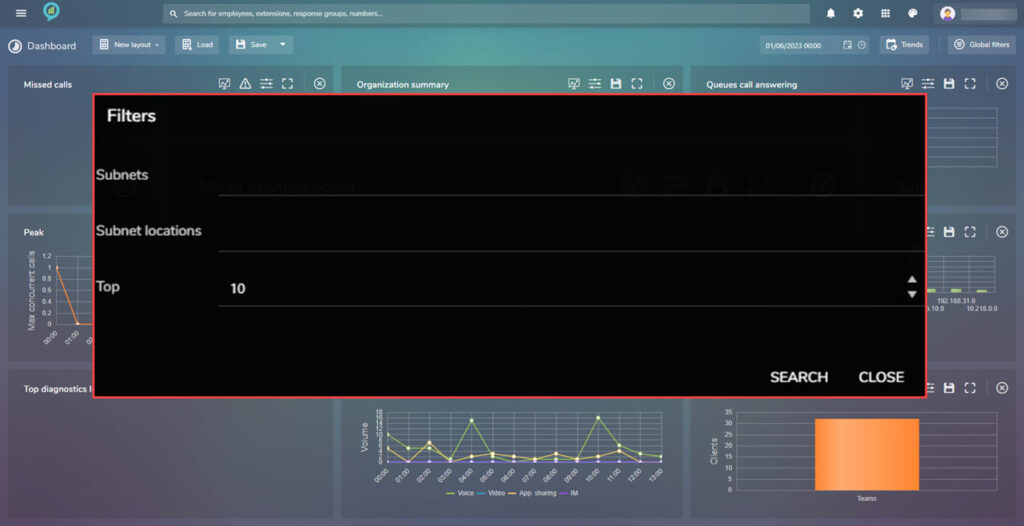
Top Diagnostic ID Failures
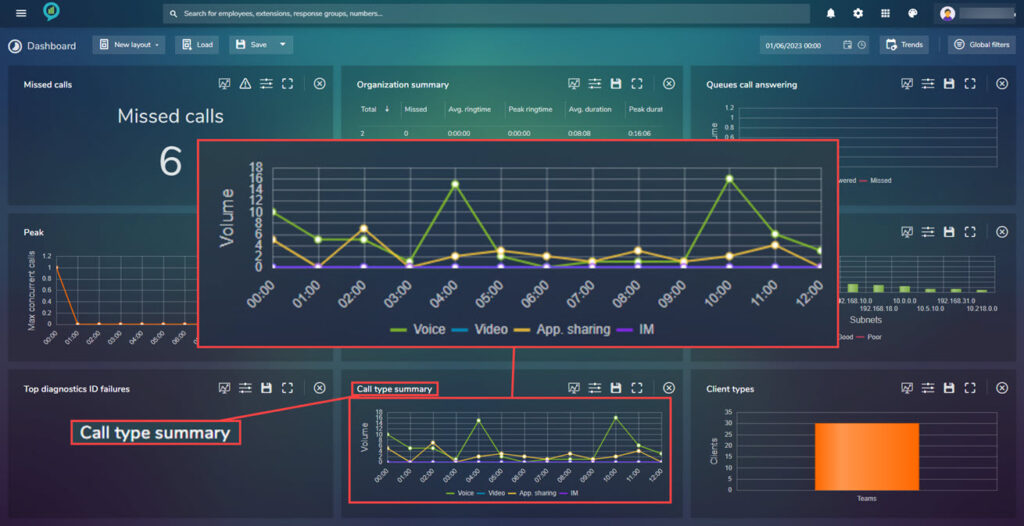
Call Type Summary
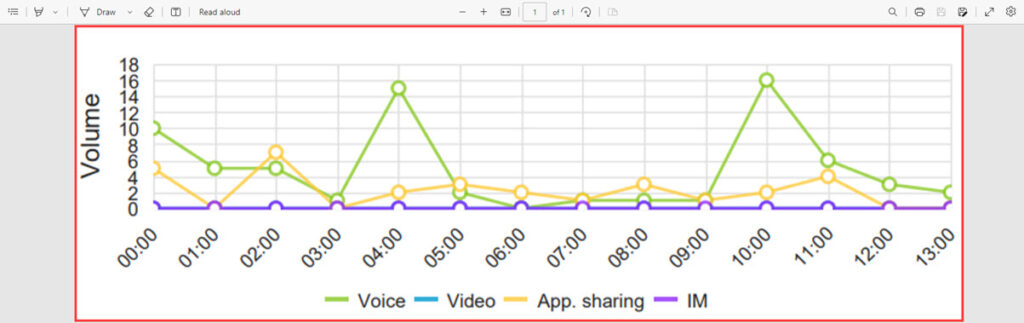

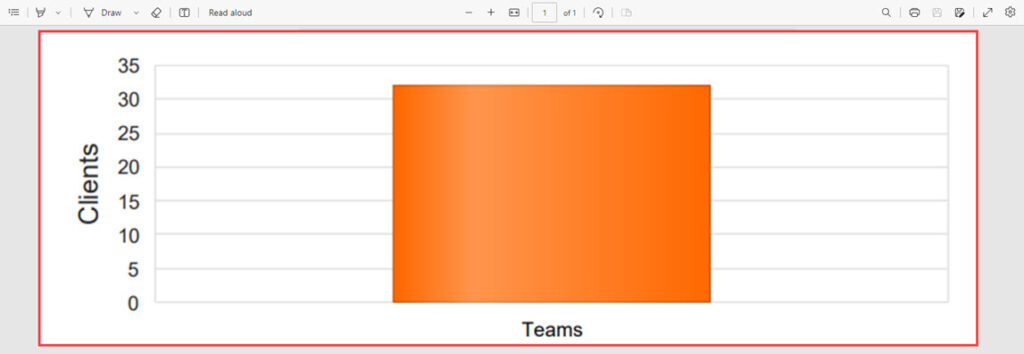
Client Types
Conference Statistics
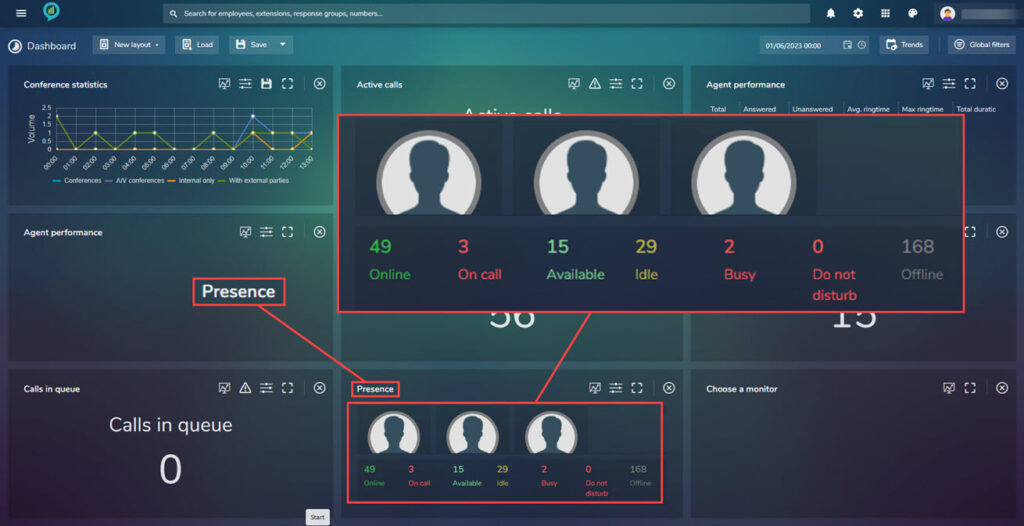
Active Calls
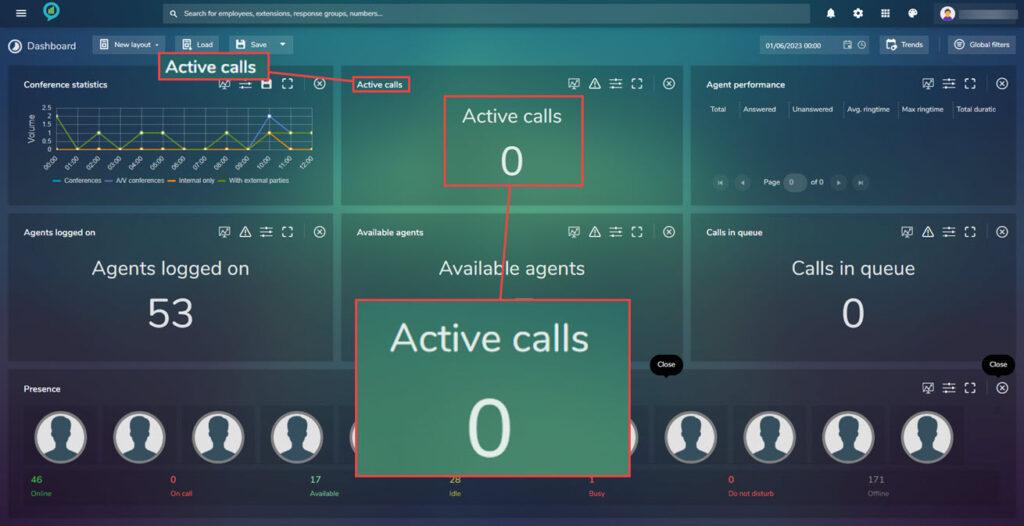
Thresholds can be set here to customize this view. These are set as described earlier.
Agent Performance (Grid)
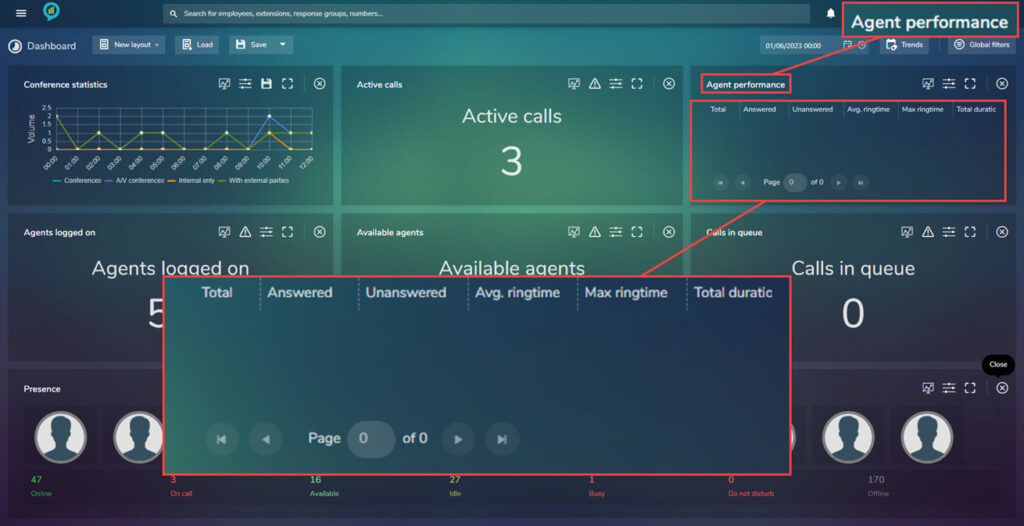
Agent Performance (View)
Agents Logged On
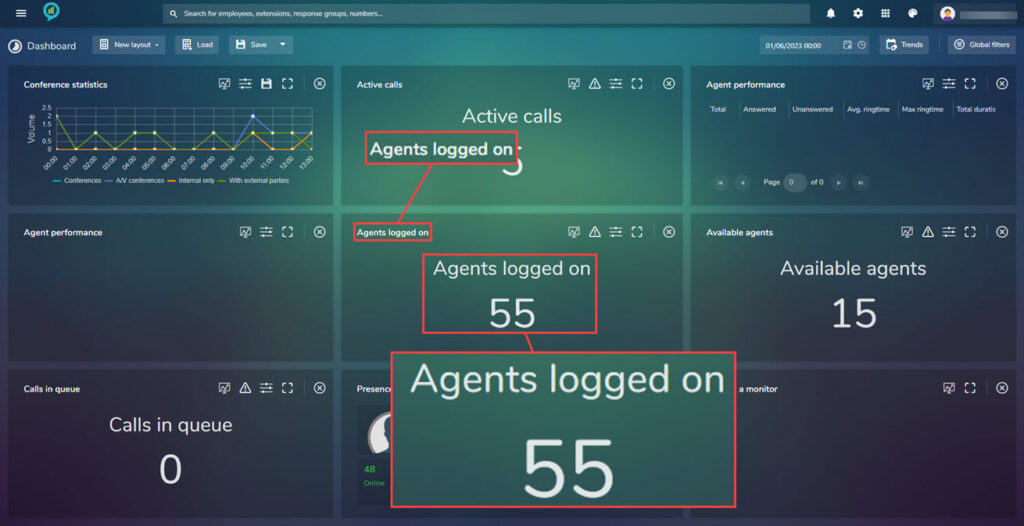
The option is available here to set the Thresholds for this view. Refer to the earlier instructions for this.
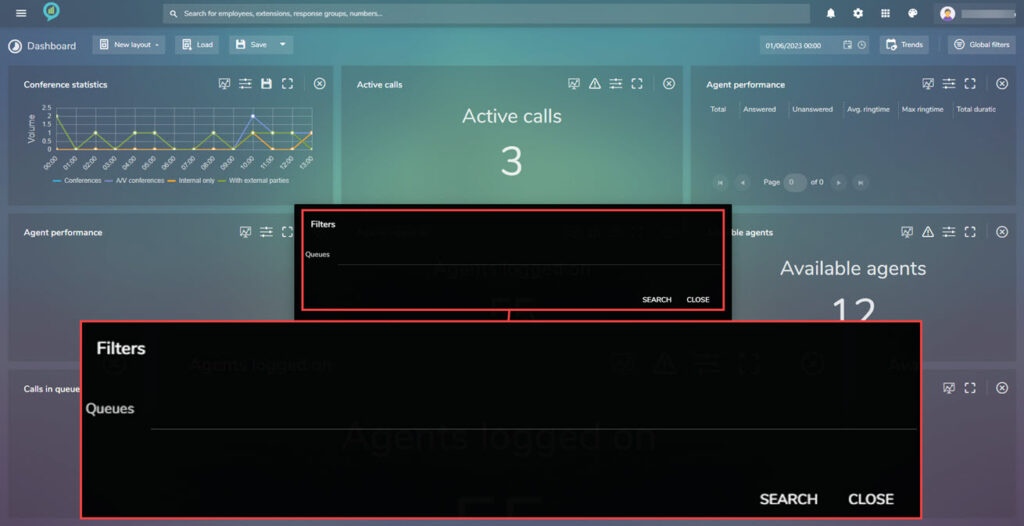
Available filters are:
Available Agents
This also has a Threshold section, as before see above.
The available filters are:
Calls In Queue
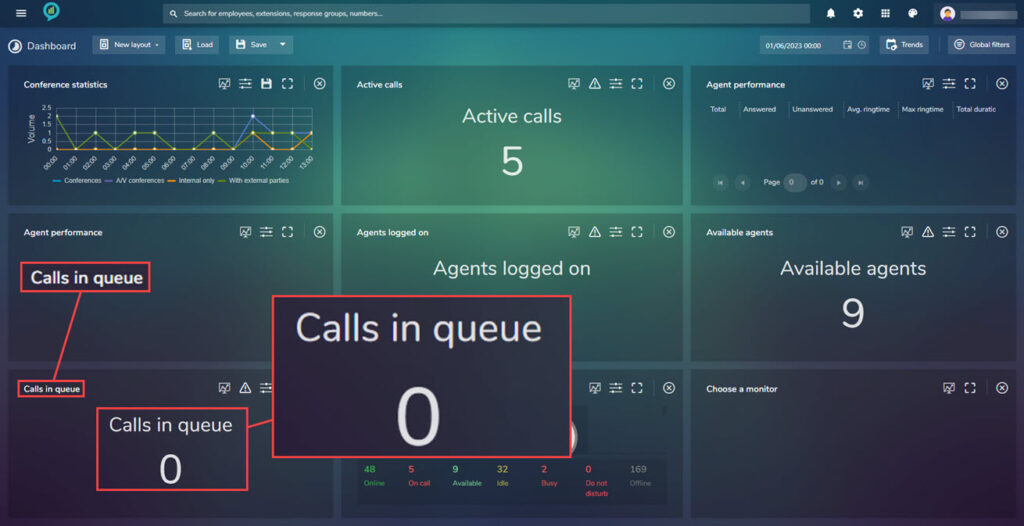
Again this view has the Tolerance setting.
Presence
Reports
Using the icon on the left (3 lines) click on Reports.
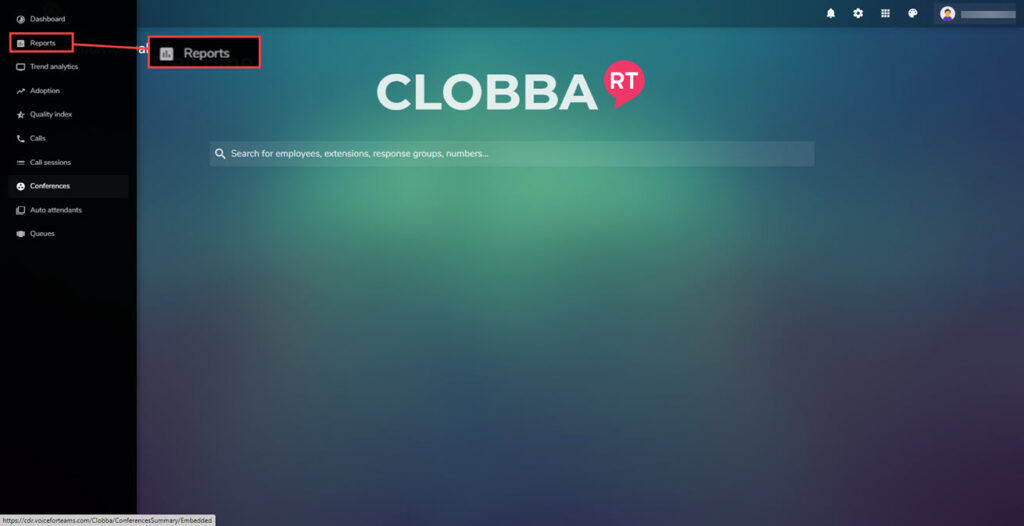
This will open a new screen, with options for the type of report you would like to create or schedule and your reports.
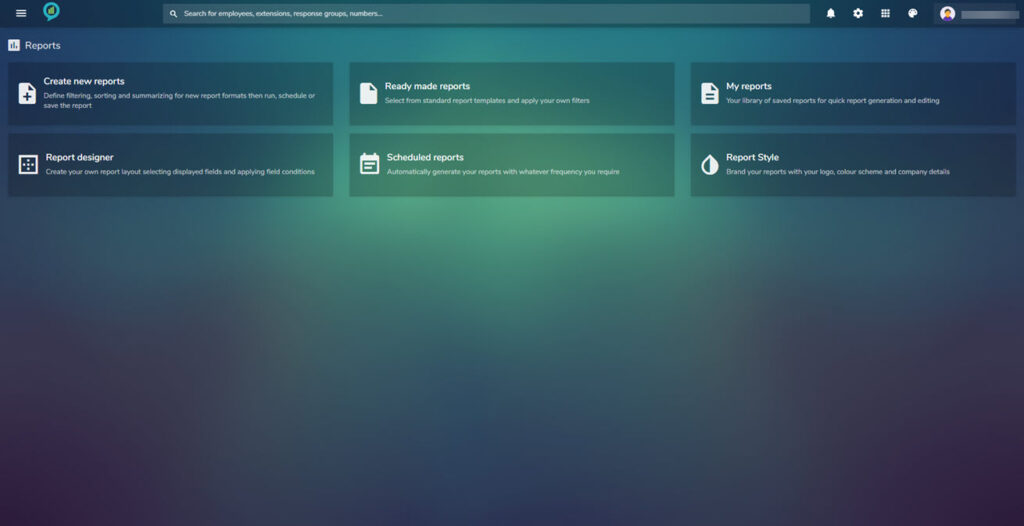
Create New Report
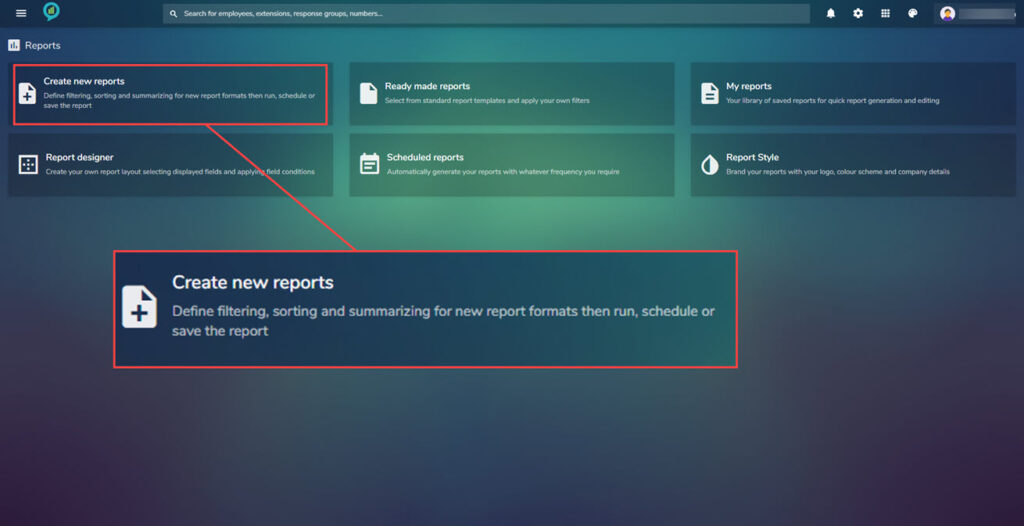
Click on Create new report, this will open the Report builder view:
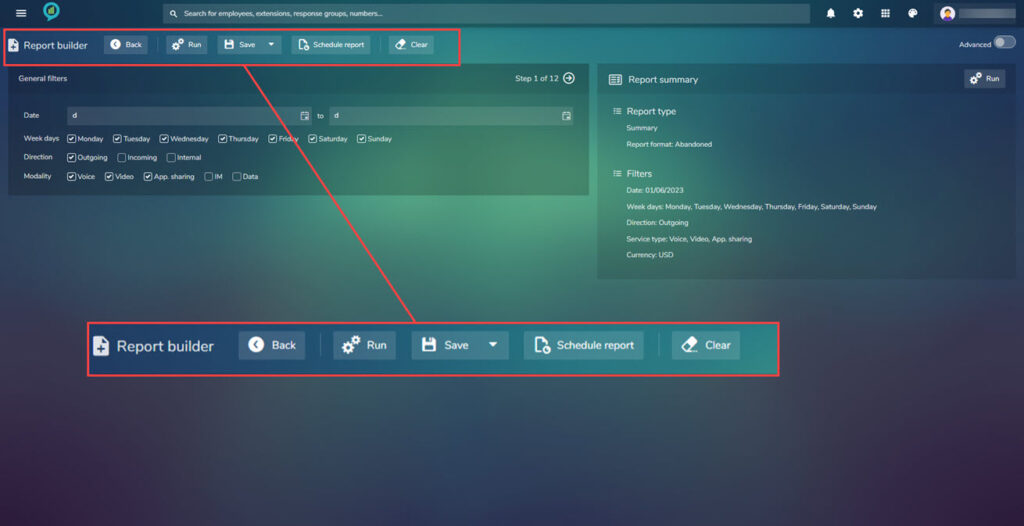
The menu in here consists of the following,: Back, Run, Save, Schedule and Clear.
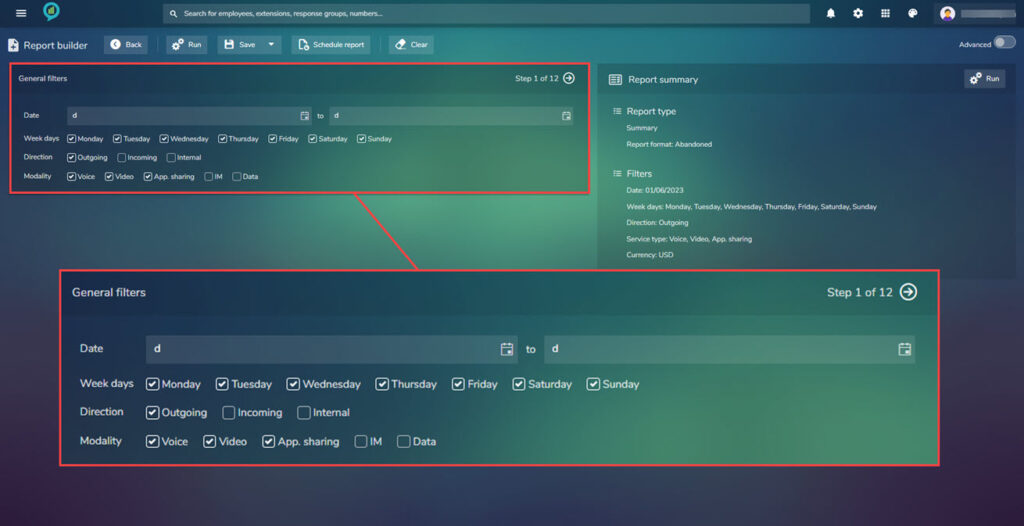
Under this is General filters. Using this section a customized report can be created in 12 steps:
When making the choices in the 12 step report creator, the image to the right of the selections will have a list of filters that have been used so far, giving a quick look at the information added so far:
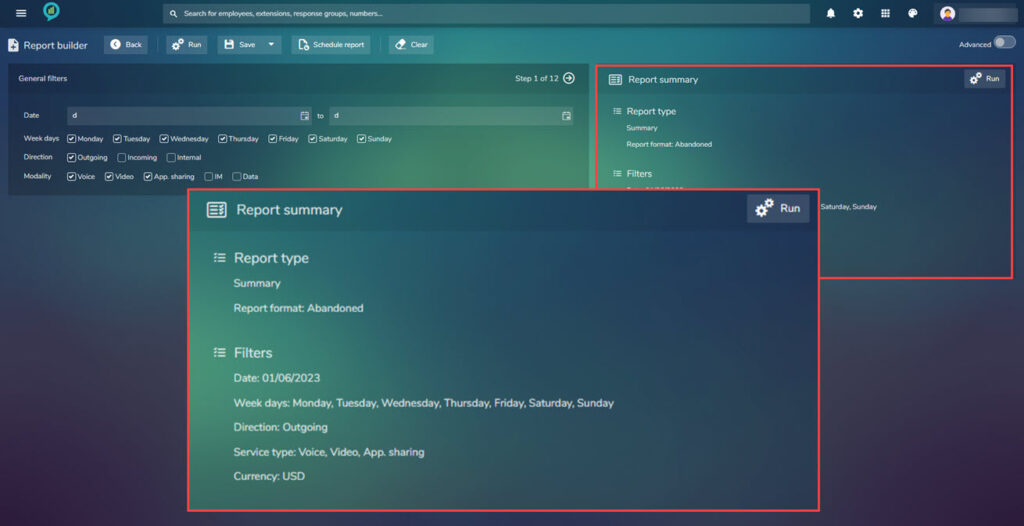
Wild cards can be used in the filters. to exclude use ‘~’ or ‘*’ will allow anything following its use.
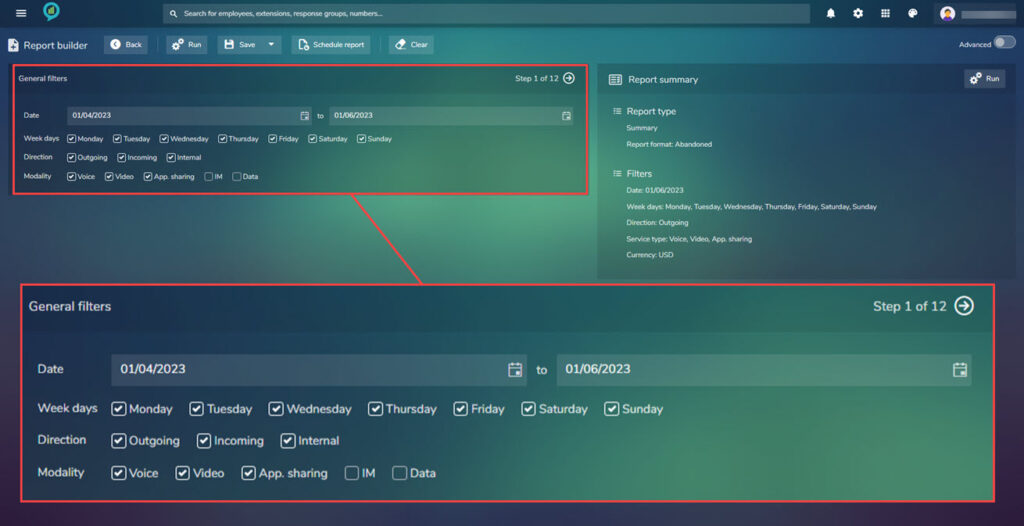
Step 1.
Select the required date (from and to). If a user clicks on the calendar icon this will open a calendar for the dates to be selected. The date can also be typed into the text box.
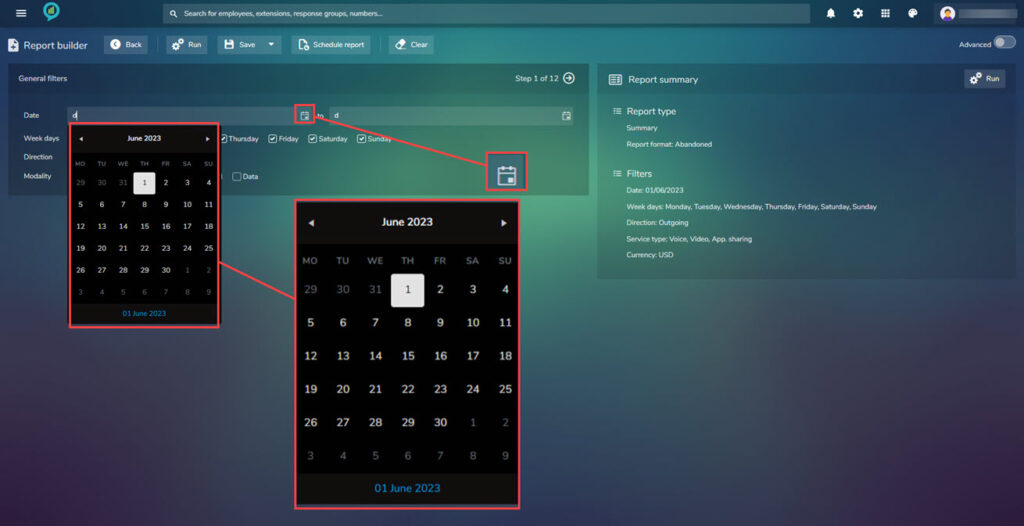
Select the days required within the report (Full seven days included). Select the direction (more than one can be set) and choose the Modality (the communication method)
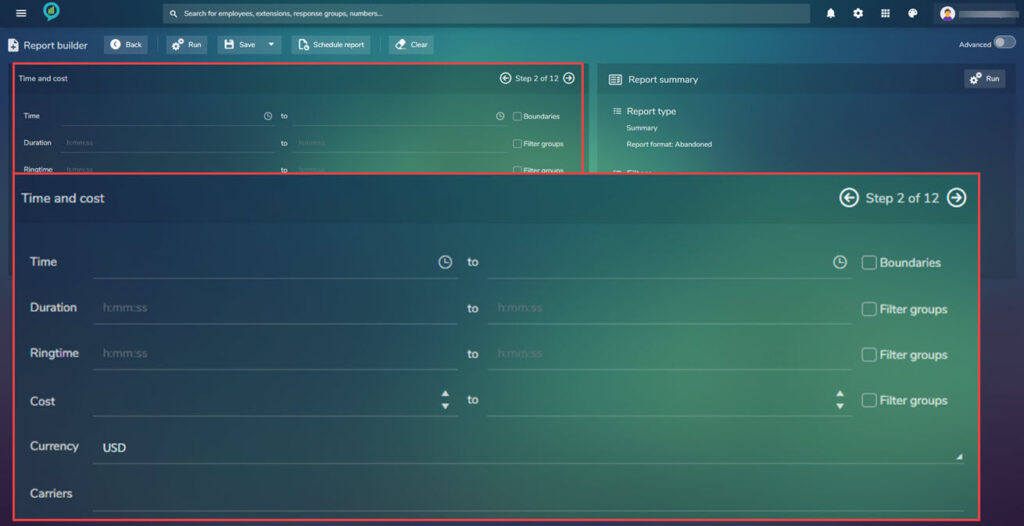
Step 2.
To go to step two click the arrow to the right of Step 1 of 12 in the top right of the box.
This next screen asks for time Duration, Ring time, Cost (to and from options) then Currency and carriers:
Clicking on the clock icon will open a drop down to select the time from:
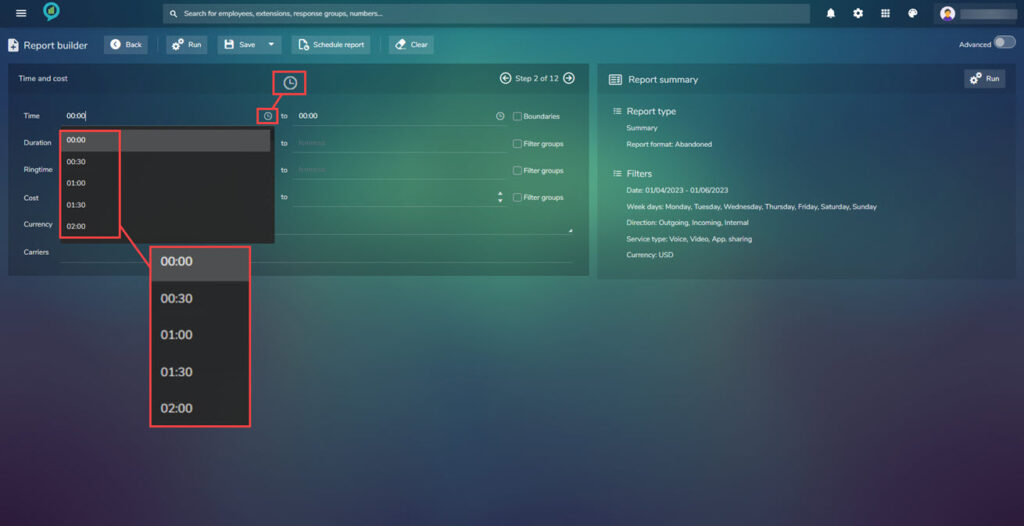
Type in the relevant times, cost and currency for the required report then click on the arrow pointing right at the top of the screen to go to the next section. Note: Not all filters have to be completed for the report to run.
Step 3.
This step is based on the Organization:
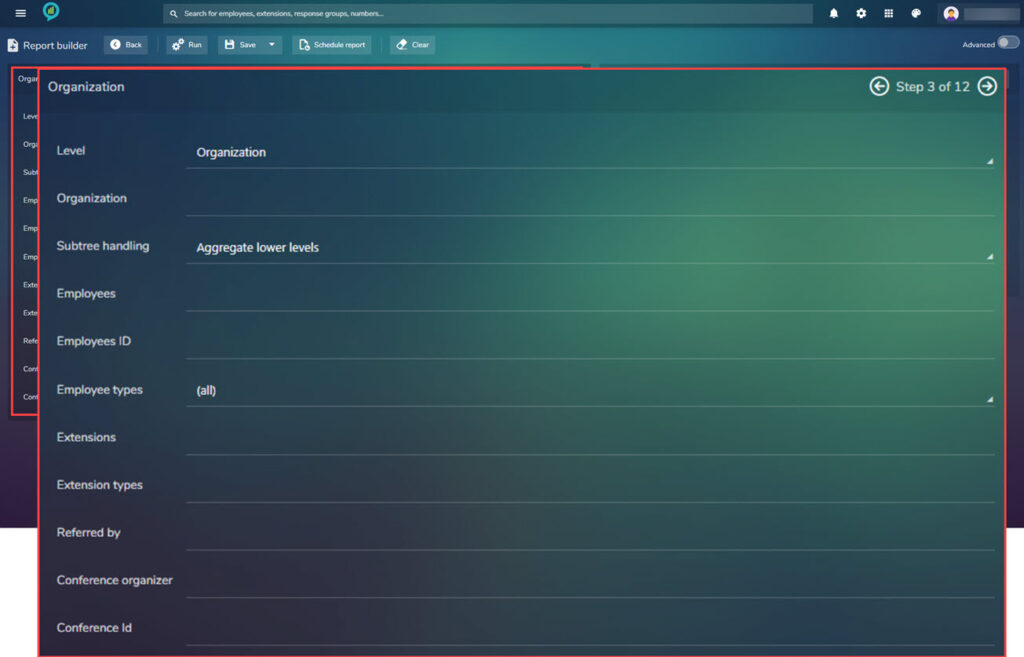
- Level – Organization, Company or Department.
- Subtree handling – Aggregate lower level, Selected level only, Separate lower levels.
- Employees – Choice of Employees
- Employees ID – Add if Know
- Employee types – All, Non, Enterprise Voice
- Extensions – Extension Numbers To Be Included
- Extension types – Type of Phone Used for Call (Cell, SIP, Fax or Phone)
- Referred by – Who Referred The Call
- Conference organizer – Name of the organizer if known
- Conference Id – Enter if known
As before not every item needs to be completed but the more information provided will produce a more detailed report. Click the arrow again to proceed to step 4.
Step 4.
Step 4 asks for the Auto Attendant and Queue information:
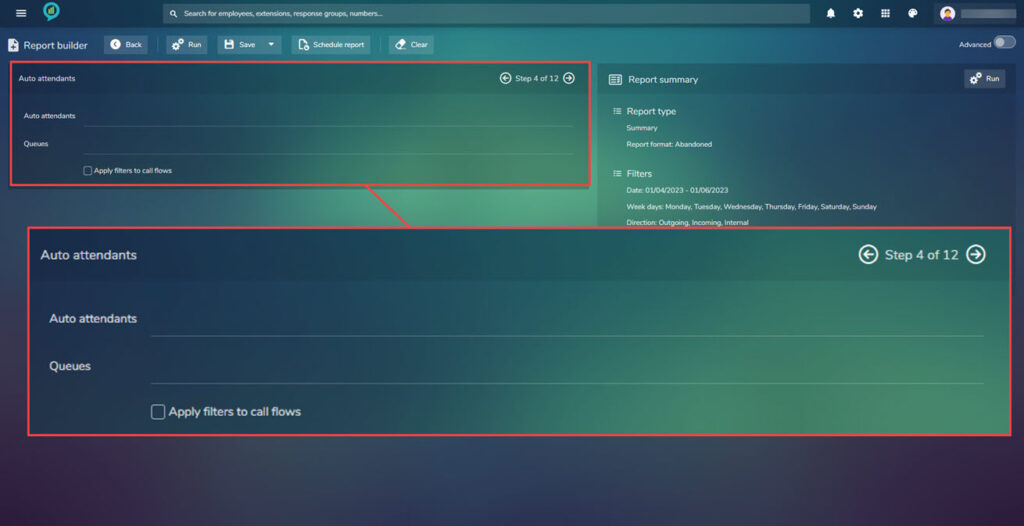
Begin typing the name of the Auto Attendant or Queue, a list of options will appear as a drop down for selection. Choose if filters should be applied to call flows by clicking on the box (a tick in the box indicates that this is selected)
Click on the arrow again to move to step 5.
Step 5.
Choose the numbers, Destinations, Directory Groups and Destination types.
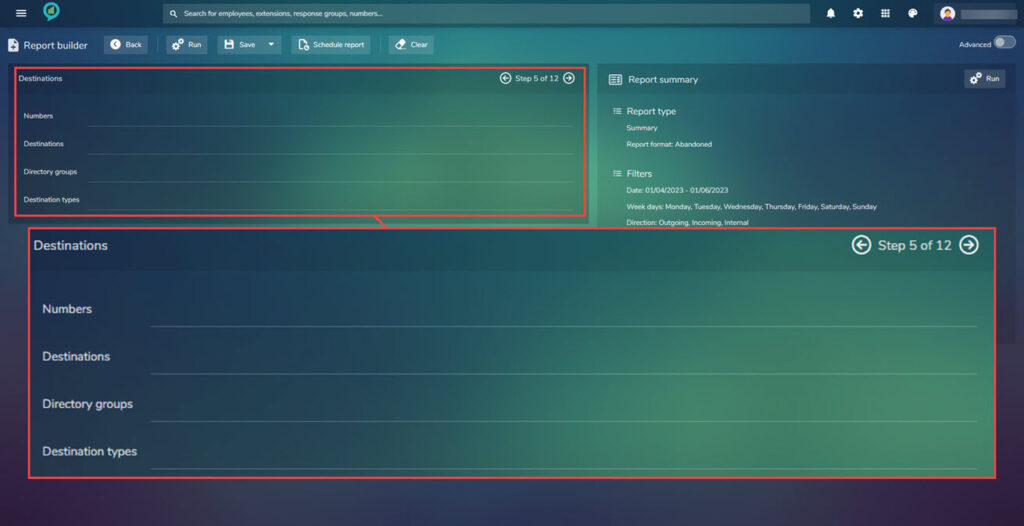
If the report is to use a specific number this can be entered in here.
The destination will depend on how the system is set up (Locations within the company).
Not all fields need to be completed.
Once finished click the arrow again to get to step 6.
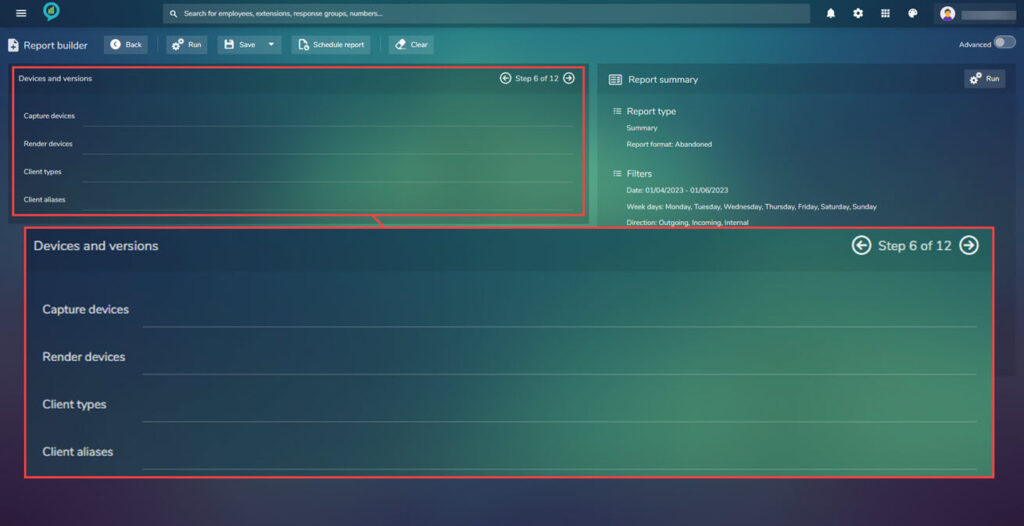
Step 6.
This section focuses on the devices and versions. Complete as needed then proceed to step 7.
Step 7.
This block contains the call types that you want to include in your report:
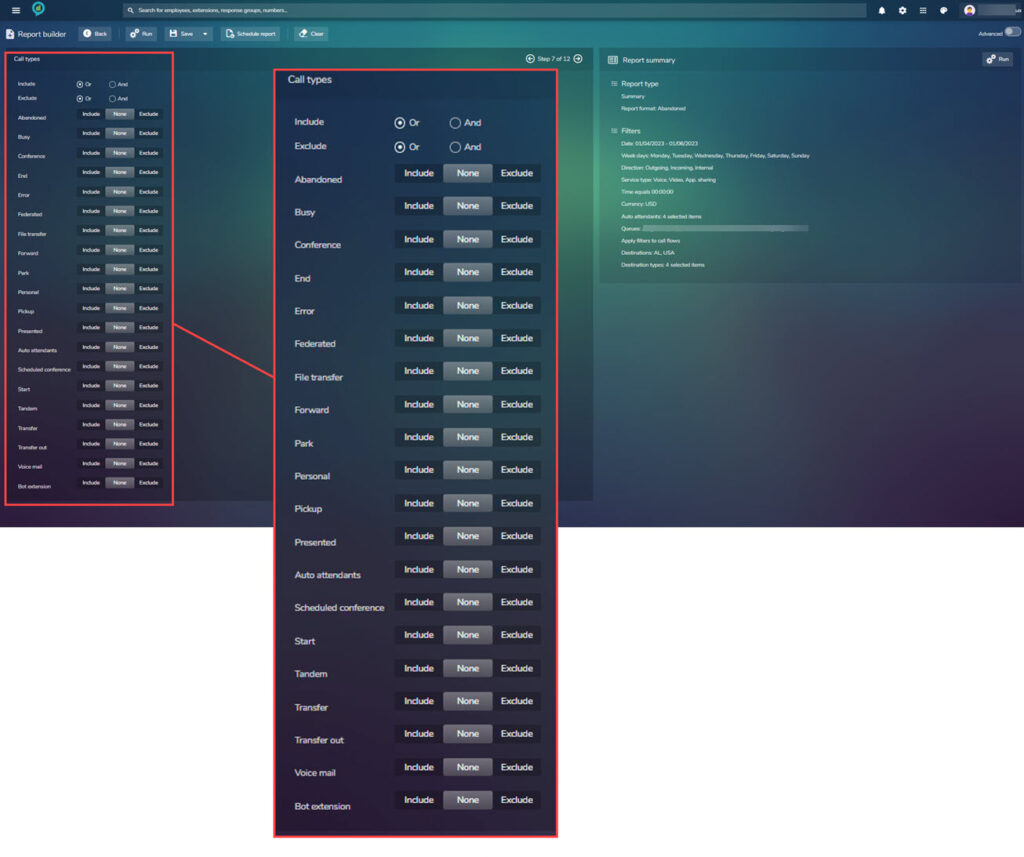
Check the list of items and select if the item should be included or excluded from the report. Once complete proceed to step 8.
Step 8.
This step is around the sorting of the report, choose what is needed then click on next (Arrow pointing right)

Sort by can be:
- None
- Ancestor unit
- Auto attendant
- Call type
- Carrier
Only one item can be selected here, then choose how these will be shown:
- Descending
- Group by
- New page after
The other options in the sort by selection are now available in the Then by field, again this has the three view options below. This field is duplicated to allow another selection.
There is an option to show subtotals. This is a tick box:
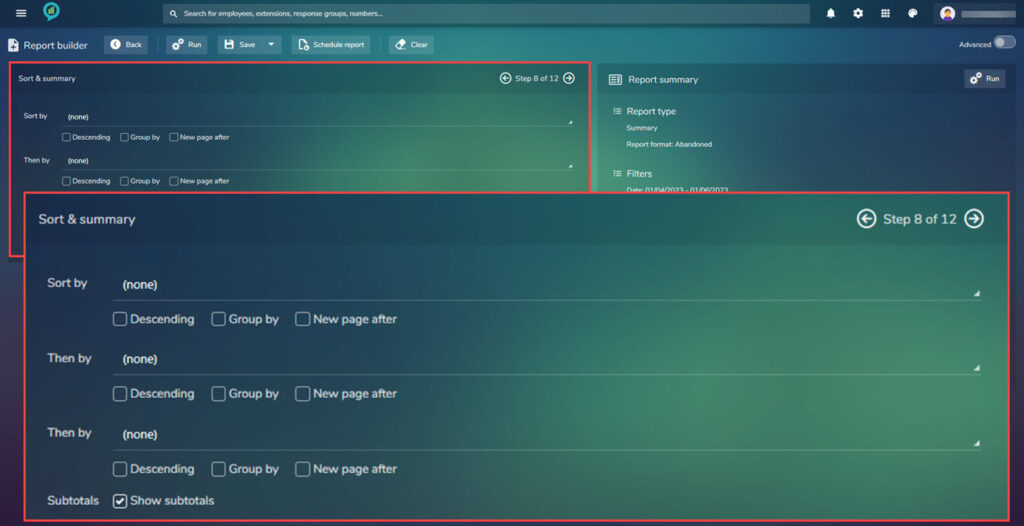
Proceed to step 9 once completed.
Step 9.
Choose report format. The list can be scrolled through using the slider bar to the right of the selection. The view here will depend on the users permissions.
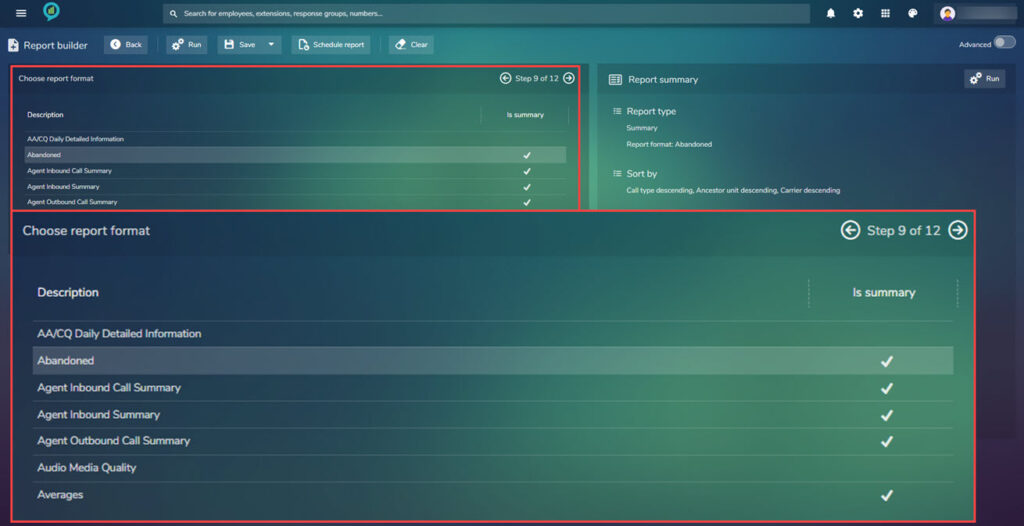
Proceed to step 10.
Step 10.
Choose how you want the report to be grouped and/or sorted:
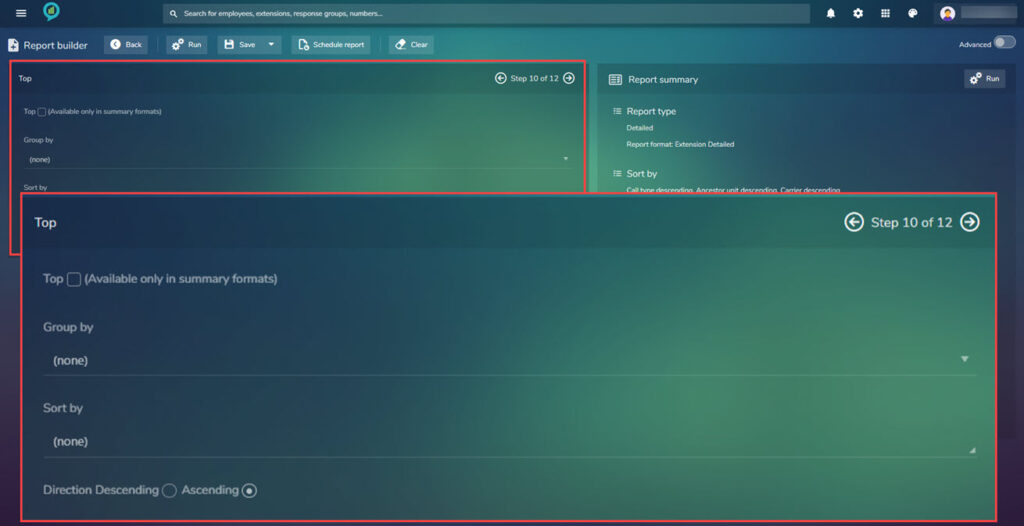
Select the options required (these may vary depending on permissions or report selections made prior)
Go to step 11.
Step 11.
Using the check boxes choose from the below options:
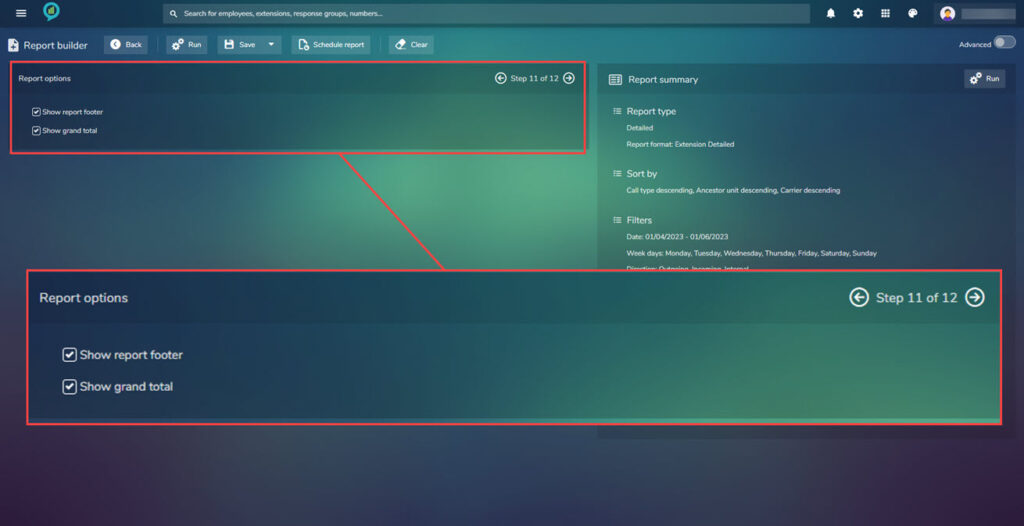
Proceed to the final step.
Step 12.
Now decide what type of report and layout is needed,.
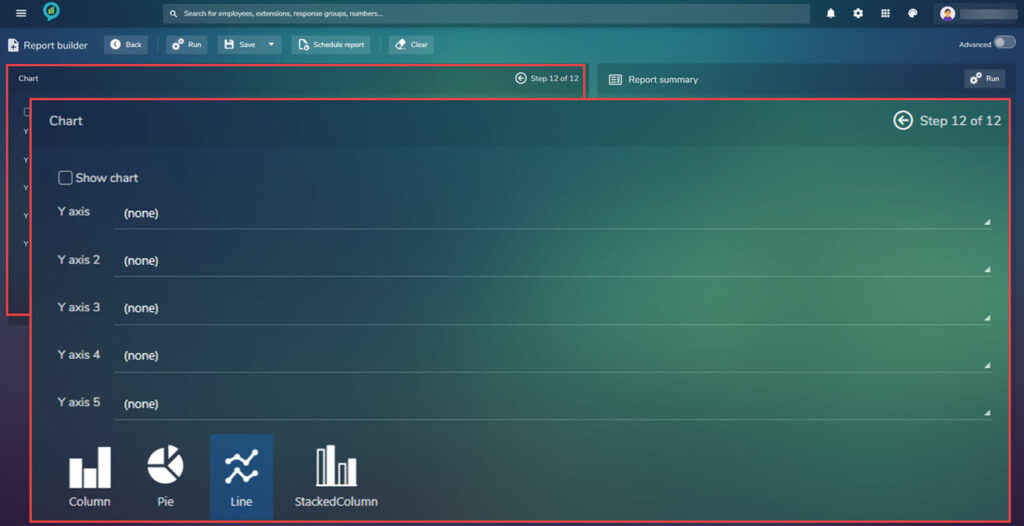
Once the report type is decided and any axis defined click run in the top right of the screen. The report will open in a new window.
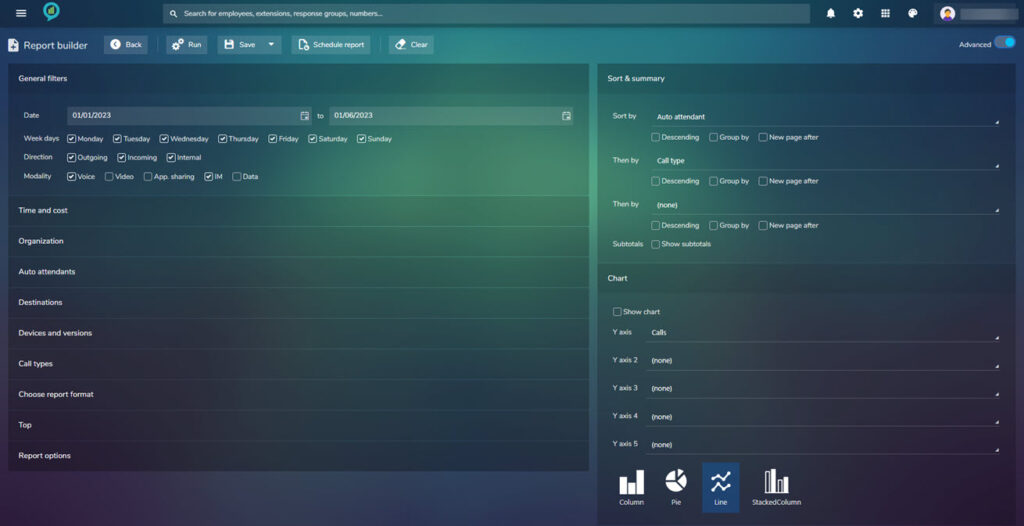
Within the 12 step report there is an advanced option, this will open the following style view:
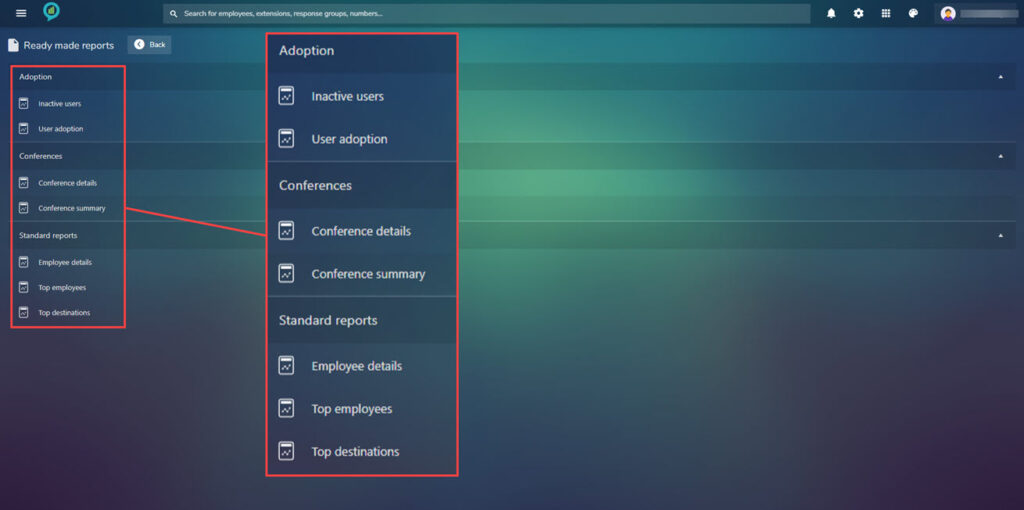
Ready made reports
On the menu page for Reports select the Ready made reports:
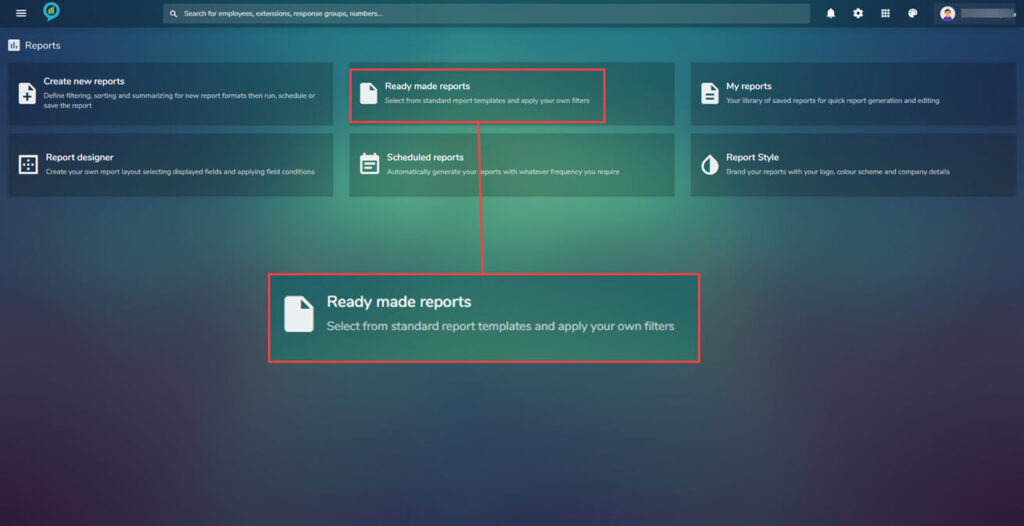
Any reports that have already been created can be found in here, this is divided into three sections click the arrow to the right to expand these:
As an example clicking on Conference details and using the date range of 3.1 to 3.3 with no additional filters:
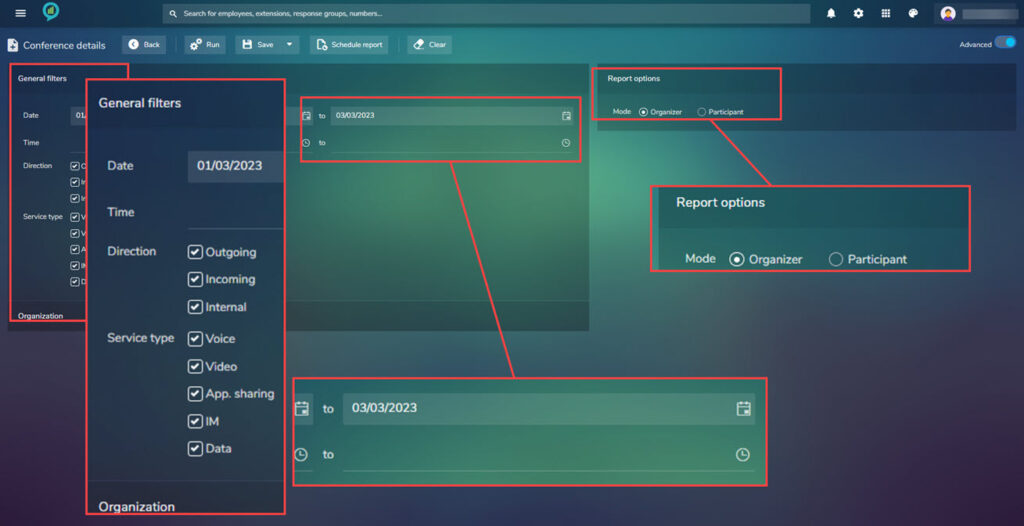
This provided the following information:
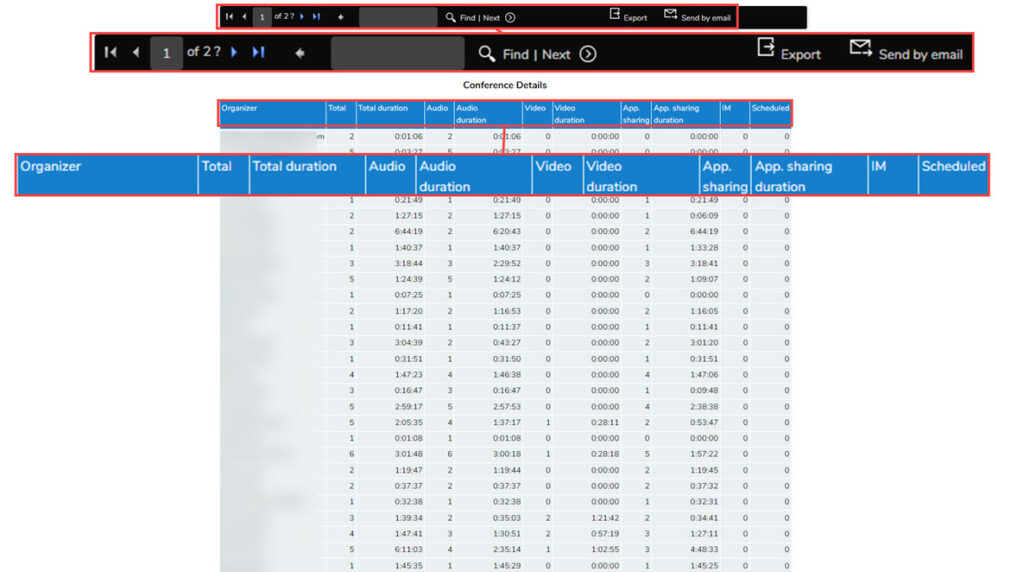
This report can then be exported or sent by email.
My reports
Going back to the menu screen for reports choose My reports:
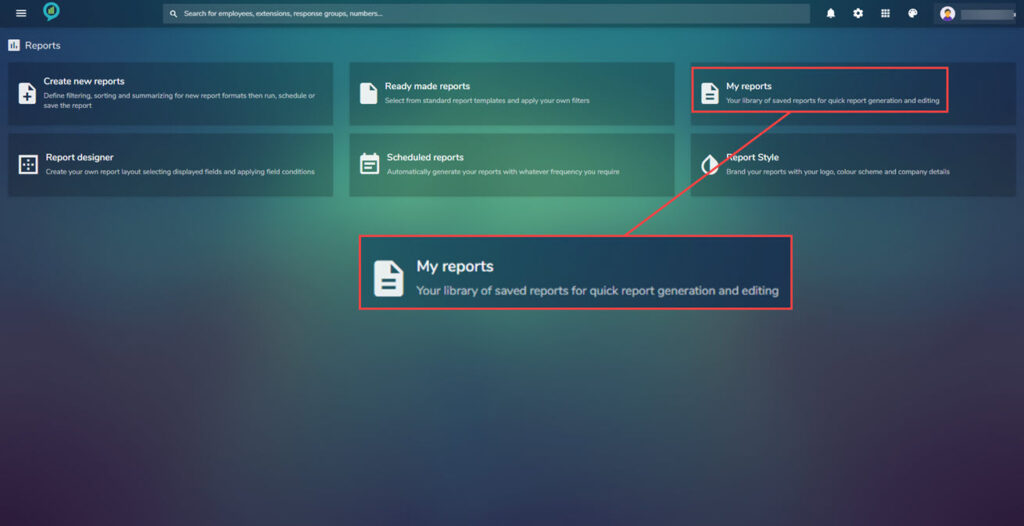
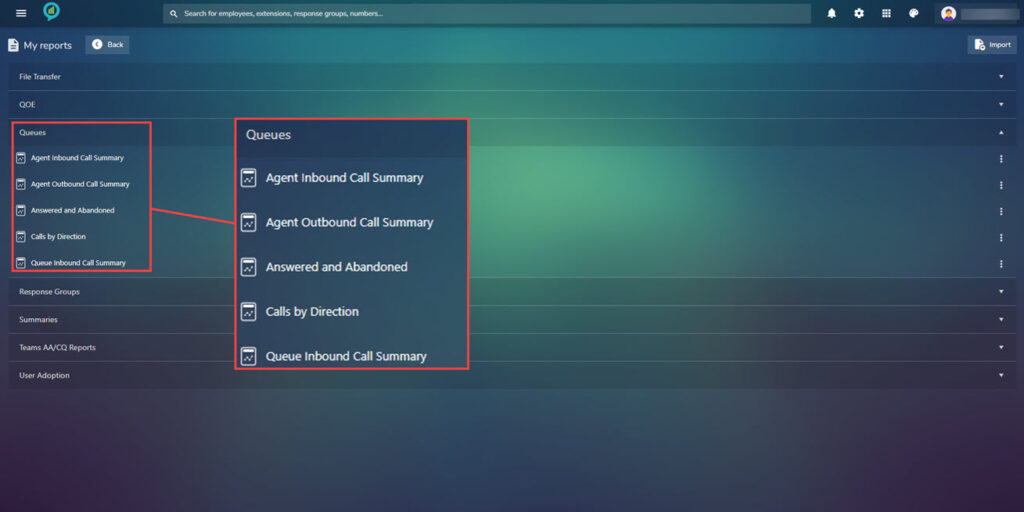
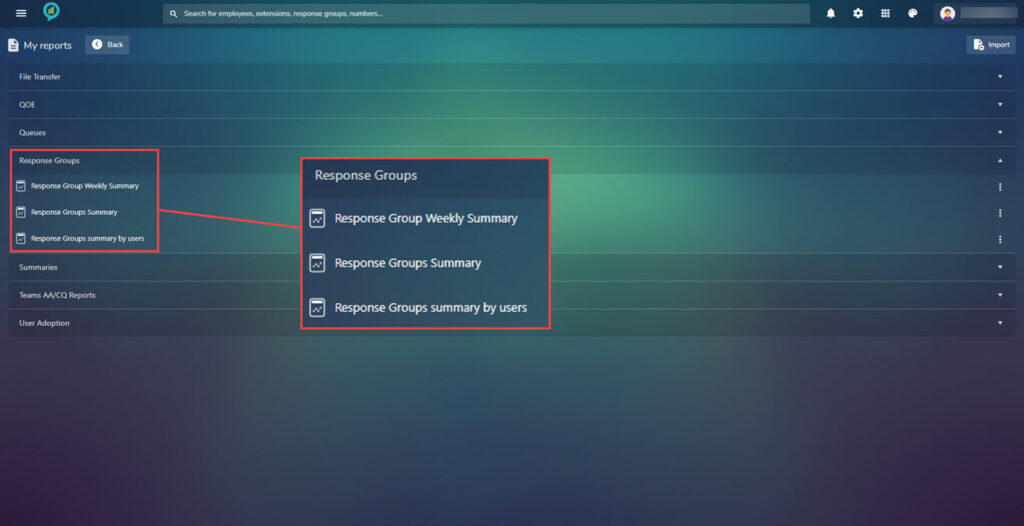
Under my reports is a library of all saved reports for a quick way to view or edit these. Again they are arranged under headings with lists below when clicked:
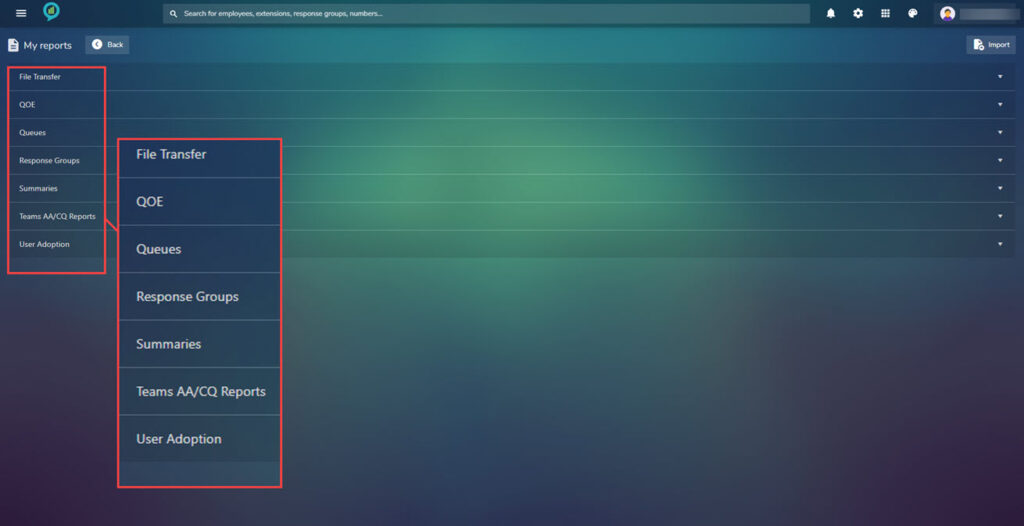
The options in these sections are shown in the below images:
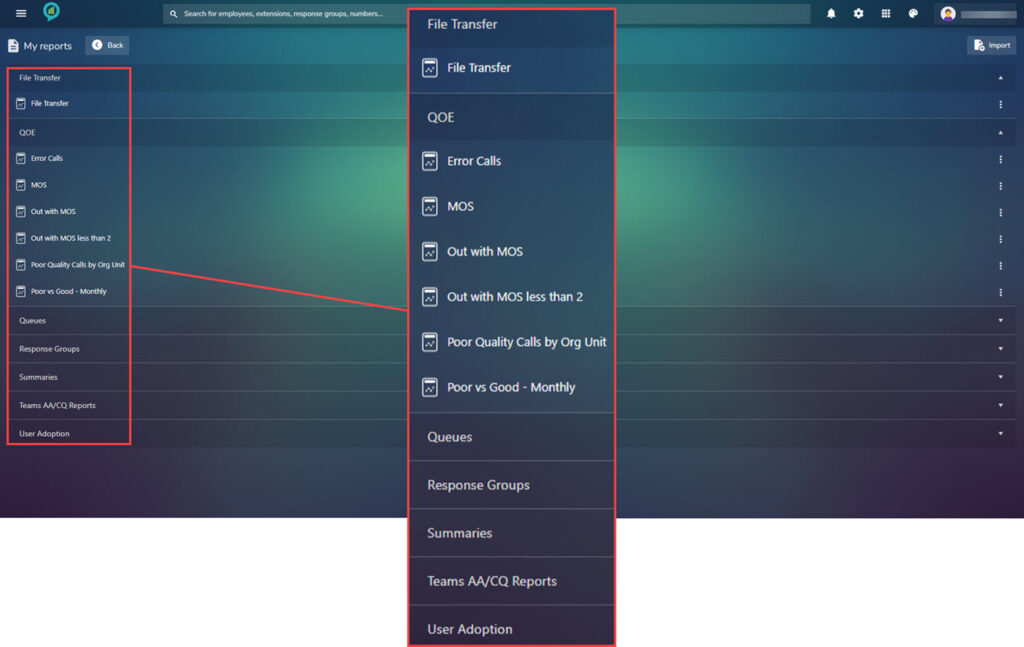
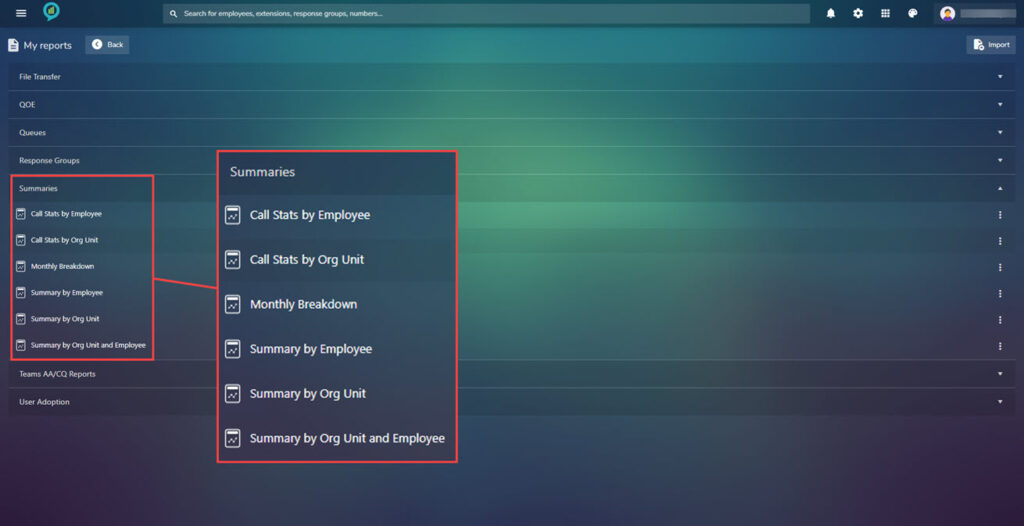
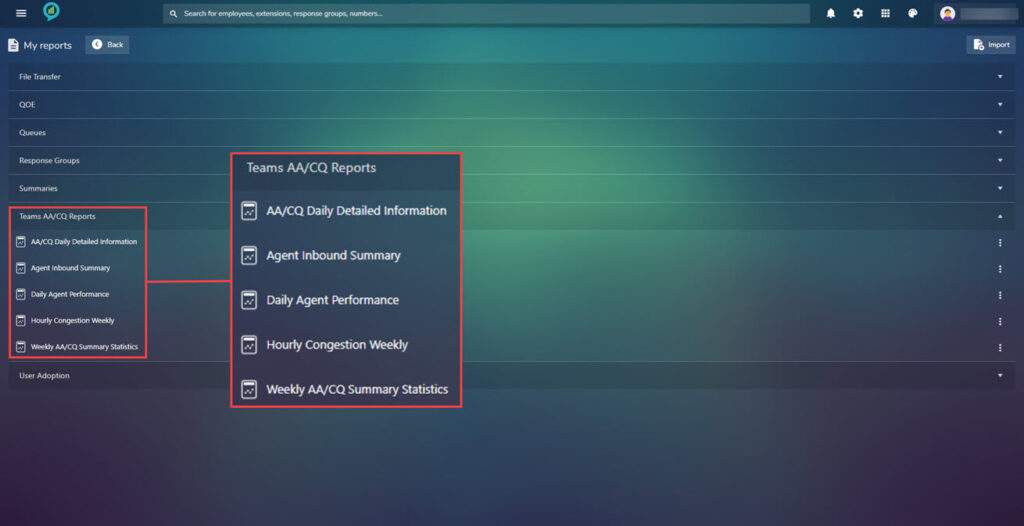
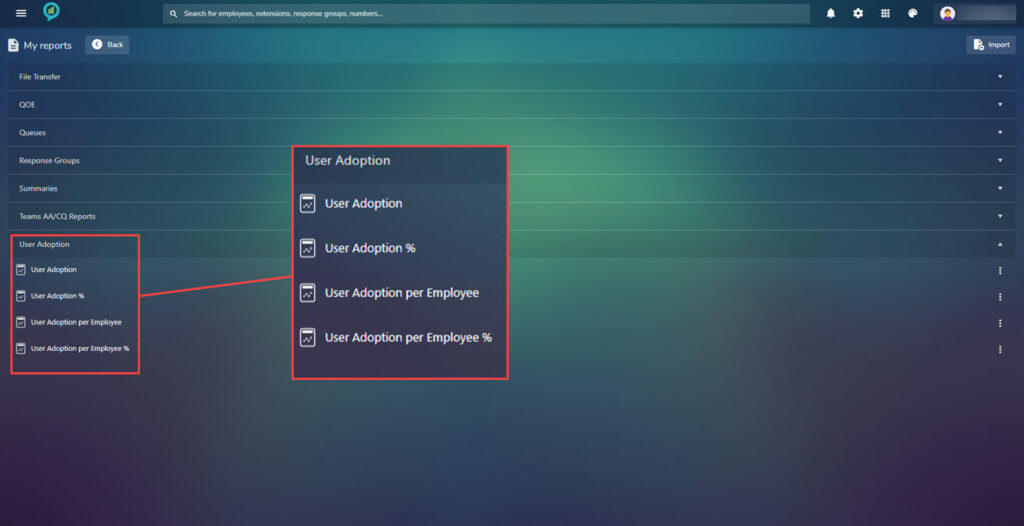
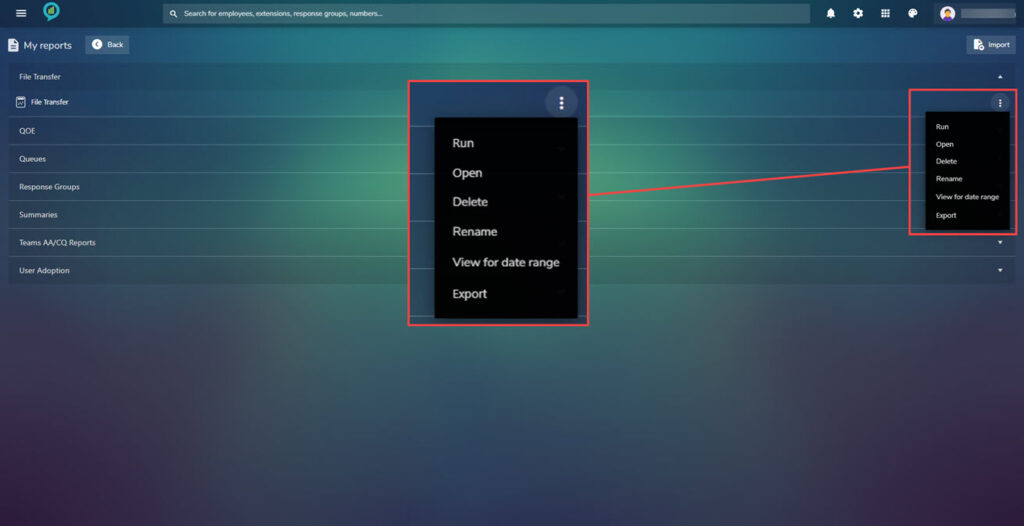
To the right of these option there are three dots click on these for more options on what to do with the report:
Report designer
This report requires assistance from Codesoftware, they will be able to create custom reports for a fee.
Scheduled reports
Access the scheduled reports from the report menu main screen:
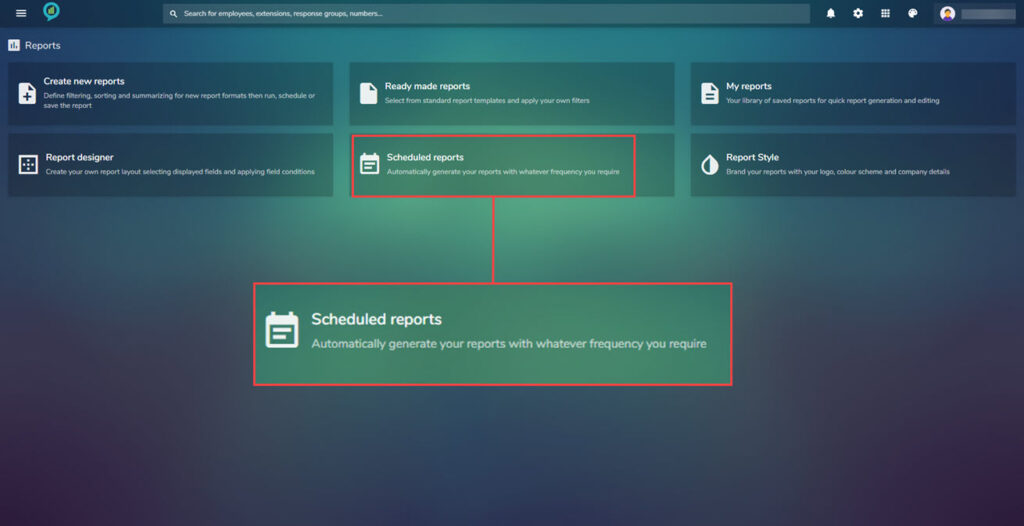
Reports can be scheduled and automatically set to run, to suit the business needs.
Once the report is set up it will appear in this section allowing for quick access. A scheduled report can be set to run at any time and be mailed out to those who need access.
An example screen:
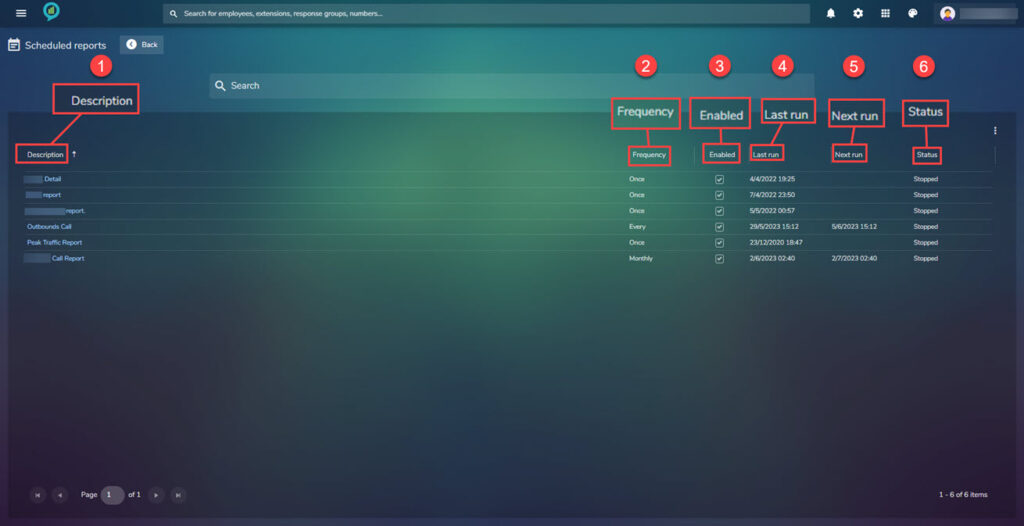
This shows the following information:
- Description – This shows the name of the report.
- Frequency – Shows how often the report is set to run.
- Enabled -The tick box indicates if the report is enabled.
- Last run – The date the report was run last.
- Next run – date the report is next scheduled to run.
- Status – Shows the status of the report.
The below screen shot shows the details that are in the Peak Traffic Report:
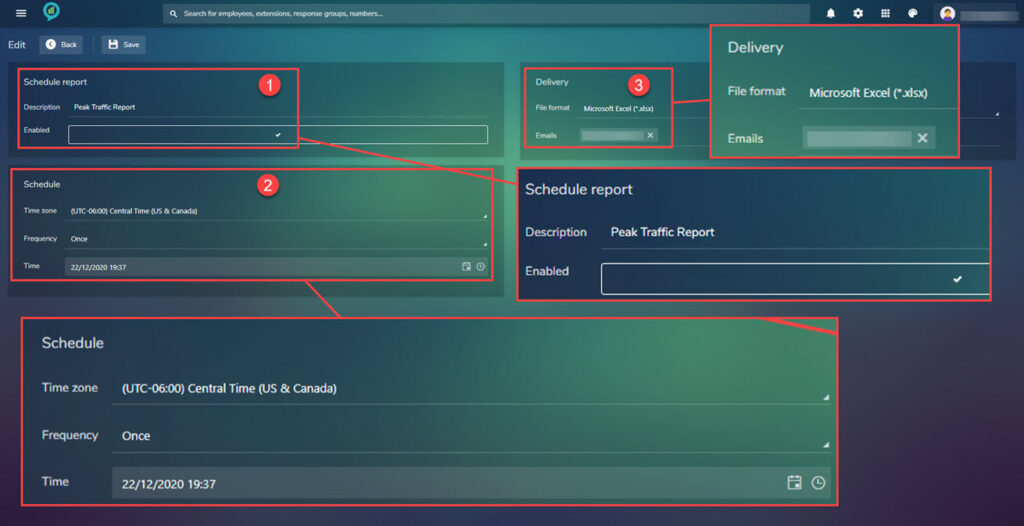
The screen is built up in sections:
- Scheduled report – This section is where the name of the report is set and the report is enabled.
- Schedule – This section asks for the Time zone, Frequency and time (including date).
- Once – Will send out the report once on the date and time as specified.
- Every – This option allows the choices of:
- Interval – Choose from minutes, hours, days or month then set the time. For example if the report is to be run and sent every 20 days, set the interval to days then the number to 20.
- Hourly – Choose the minute the report should go out, then select the days and the active hours.
- Daily – A daily report will go out at a time that has been specified on the days chosen.
- Monthly – This report will run once per month on the date and time that is chosen.
- Delivery – File format can be Microsoft Excel (*.xlsx), Adobe PDF (*.pdf), Microsoft Word (*.docx) and as a Comma Separated Values (*.csv).
- Frequency – Set the frequency of the report choose from:
The time option will change depending on the Frequency that has been selected. In the Delivery box select the file format for the report then add the email addresses of the recipients. Once completed click on Save located in the top left of the screen.
Report style
Navigate to the reports menu again then click on Report style:
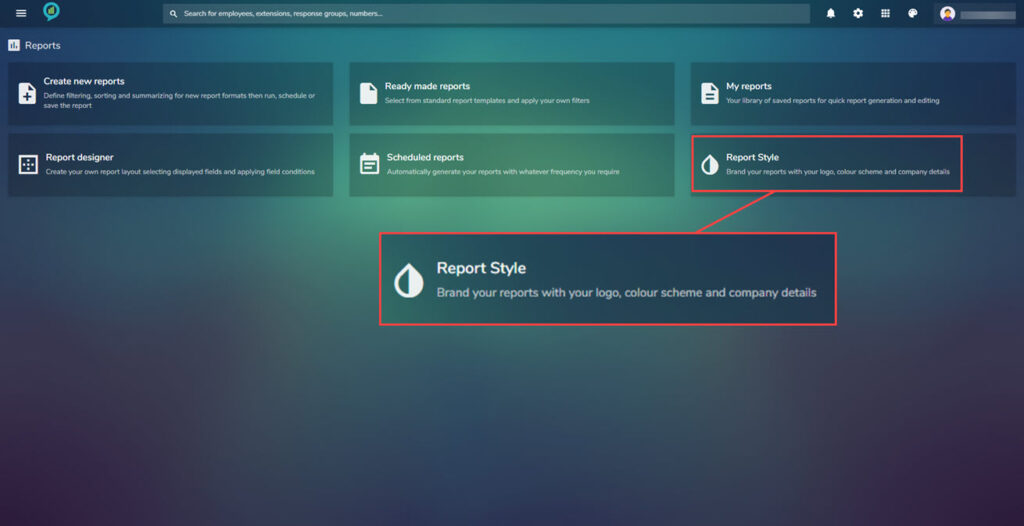
In this section personalization can be added. Company logo, color ways and company information. Looking at the below images it shows what can be customize and gives a preview of how any changes will look. Below is a snip of the screen with the menu in the scroll bar shown to the right:
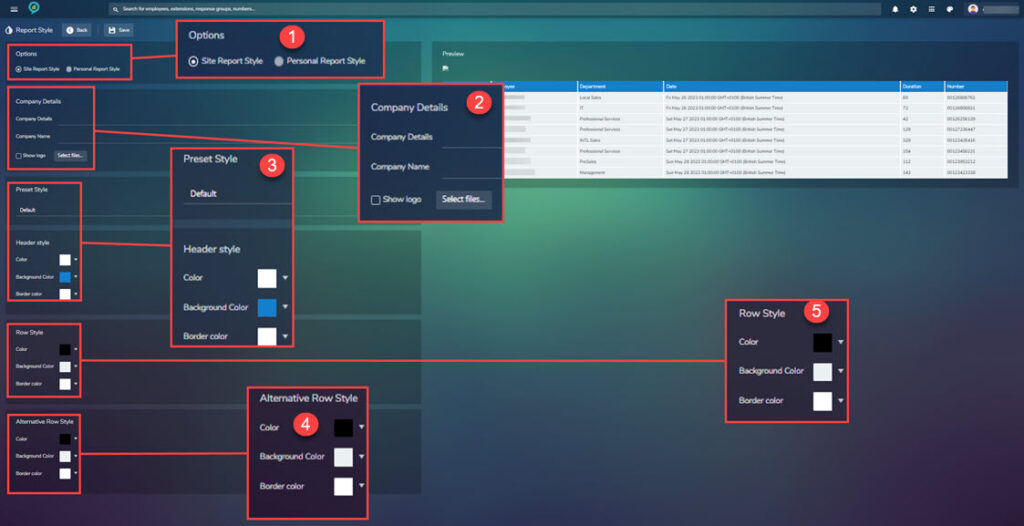
The options are:
- Options – Choice of Site Report Style or Personal Report Style.
- Company Details – add the company details and name, there is also a show logo tick box and a select files for adding the logo.
- Pre-set Style – There is a drop down here with the following choices:
- Default.
- Neptune.
- Gray.
- Black and White.
- Blue.
- Blue and Beige.
- Header Style – There are three options to choose for here:
- Colour – This can be set at any color, click the drop down and a box will appear where a color can be picked or a hex code. Click apply to save any changes.
- Background Color – As above.
- Boarder Color – Again the same as Color.
- Row Style – Again this section contains three setting options. These work in the same way as the Header Style.
- Alternative Row Style – Again another three options that can be set as for the Header Style.
Remember to click apply after any changes to save these.
To the right of the screen is a Preview section. This will show how the report looks as you make changes.
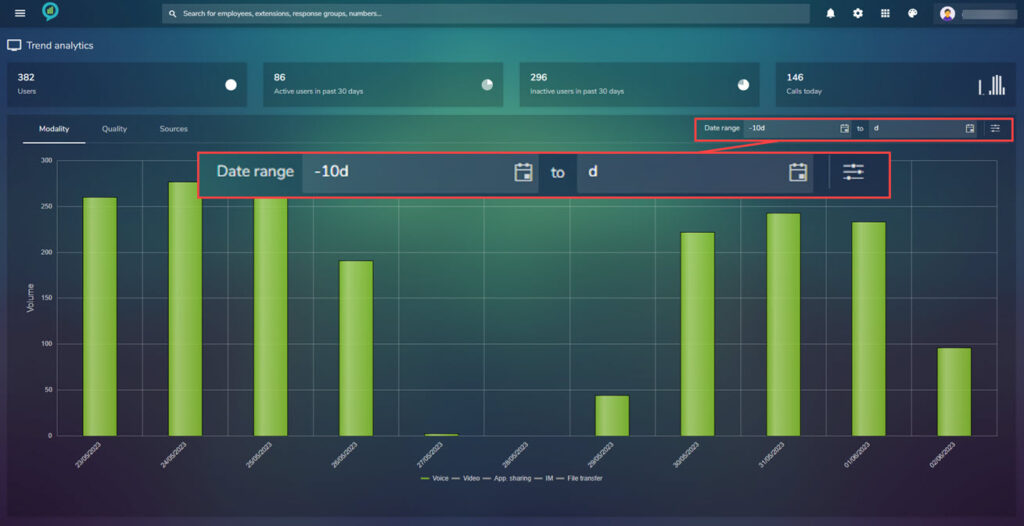
Trend analytics
To navigate to Trend analytics click on the menu icon then select Trens analytics:
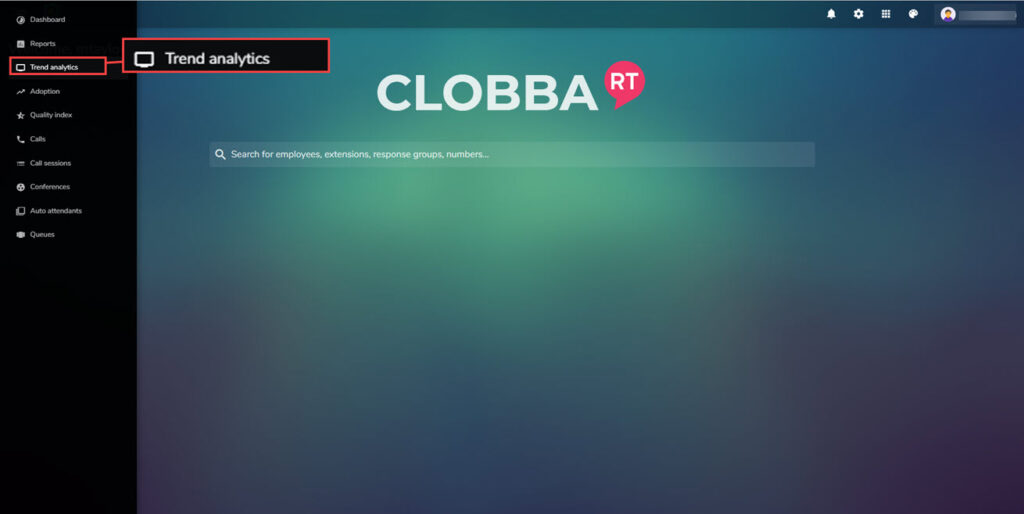
Trend analytics gives a clear overview of the entire system performance showing Modality (user adoption), consumption and call quality.
The below image shows an example of the view to expect when opening this section:
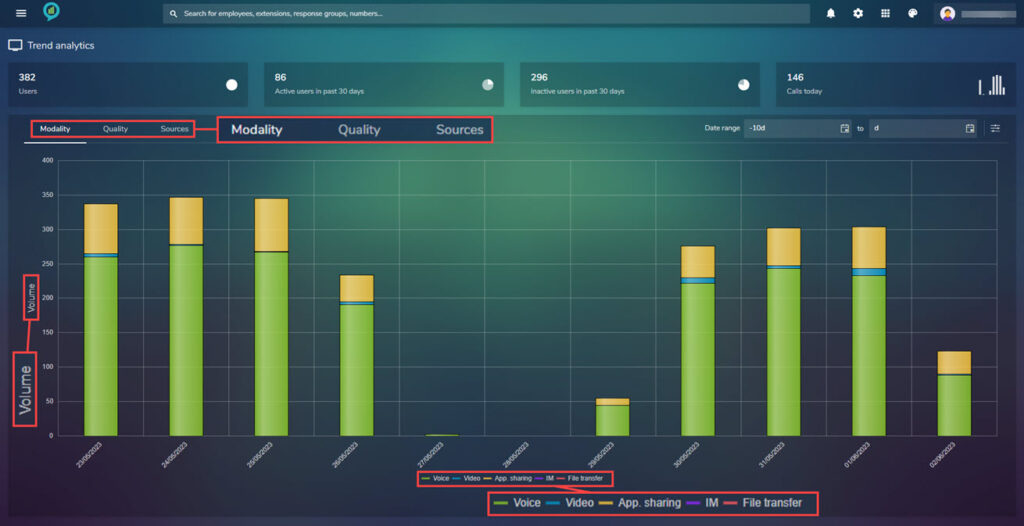
Across the top of the report are the options to view, Modality, Quality and Sources. These are shown in more detail a little further down this document:
- Modality.
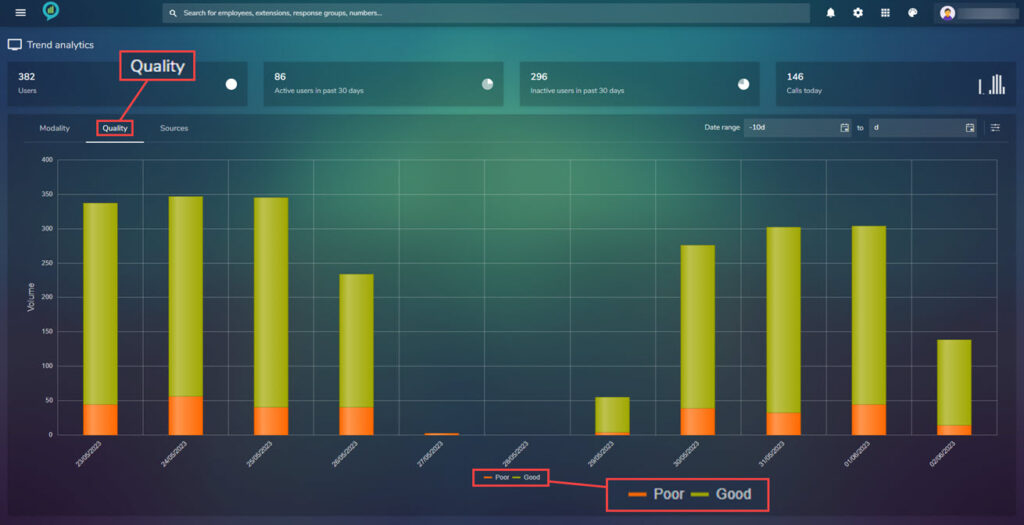
- Quality.
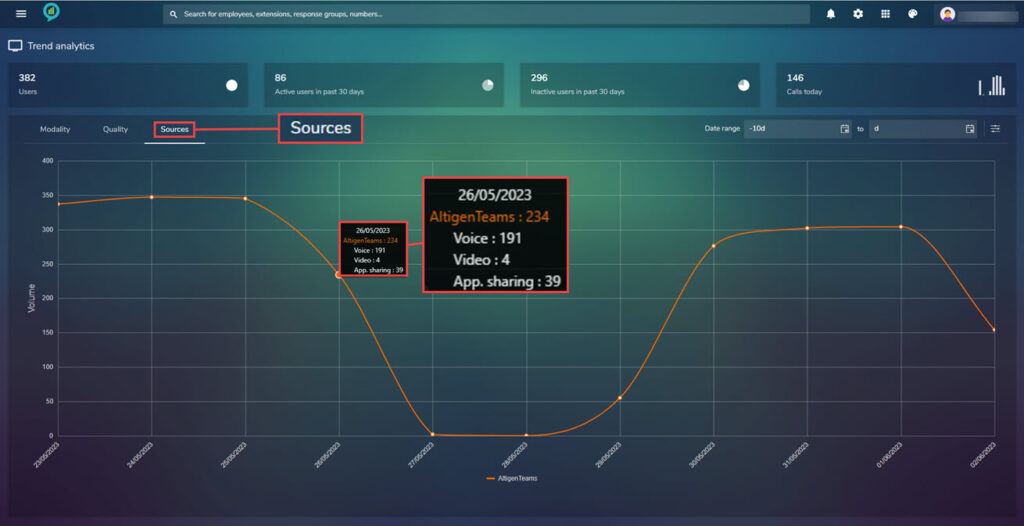
- Sources.
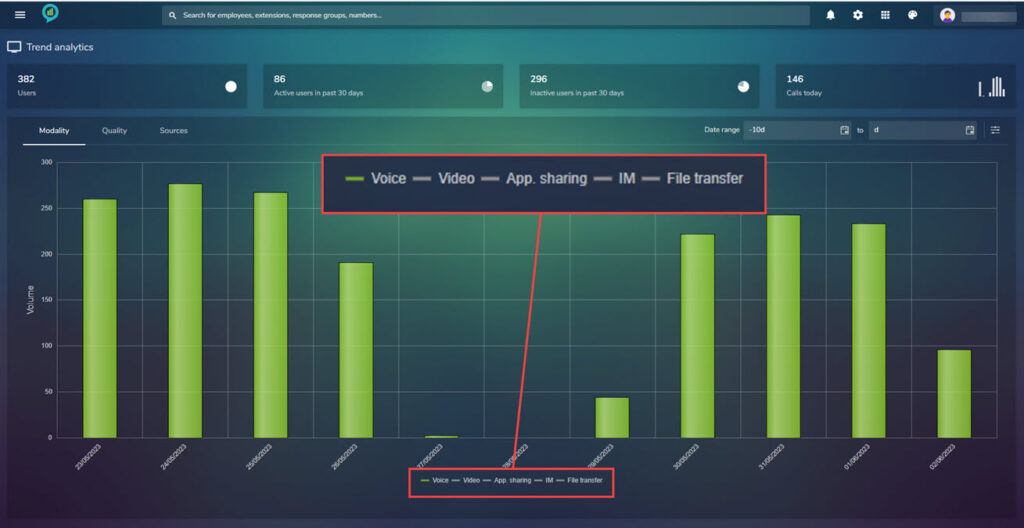
At the bottom of the report is a menu bar based on color. In any of the report views selected the user can select the information shown using these color choices.
For example:
The below shows the Modality report with only voice selected. To select or deselect these options just click on the little bar by the title, this will grey out if deselected:
In the top left is an option to filter by date (from – to)
Clicking on the filter options (top right shown below) opens a box with options for: Level, Organization, and Modality options. (below images for example)
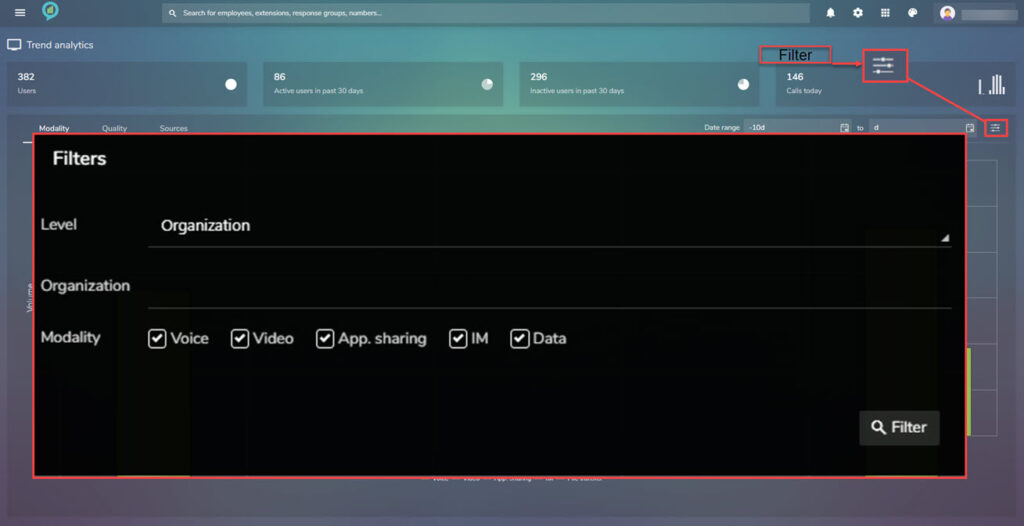
The level in the filter options can be set to any of the following:
- Organization.
- Company.
- Department.
If a single day is selected the details are broken down per hour.
For a larger date range details are totalled with daily intervals.
Further details can be seen at the top of the system monitor. These are:
- Users – The user figure is taken from the number of users enabled in active directory.
- Active Users in past 30 days – This shows the number of users who have been active in the past 30 days.
- Inactive users are those that have not made a call in the last 30 days, a call being defined as Voice, Video or IM, this will give an indication of consumption.
- Calls today – Shows the total number of calls for the day.
- Call quality is an essential element for the successful delivery of Teams. The quality system monitor shows the total number of “good” quality calls and “poor” quality calls. The criteria is in line with the Microsoft methodology of defining the call quality.
The Sources screen displays the average call quality per every data source.
Adoption
To access the Adoption section, click on the menu icon then choose Adoption:
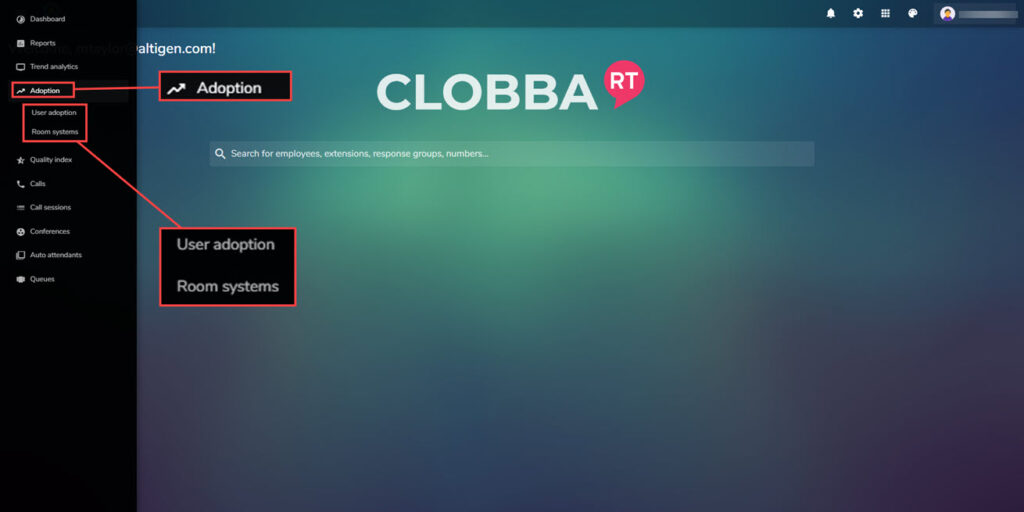
When choosing Adoption from the side menu there are 2 options:
- User adoption.
- Room systems.
Starting with User adoption:
This gives an overview of how many users are using the system:
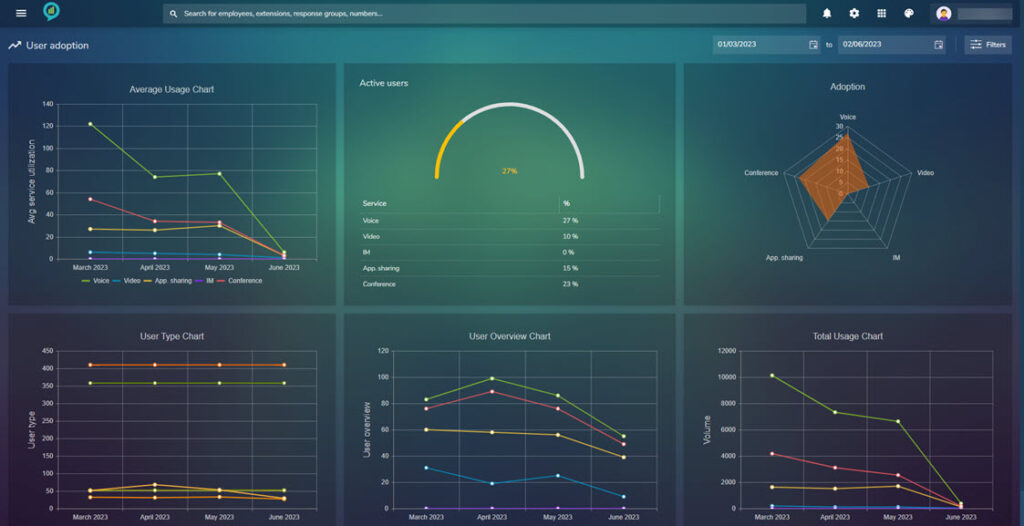
The date range can be set in the top right, as before the colored lines can be filtered by clicking:
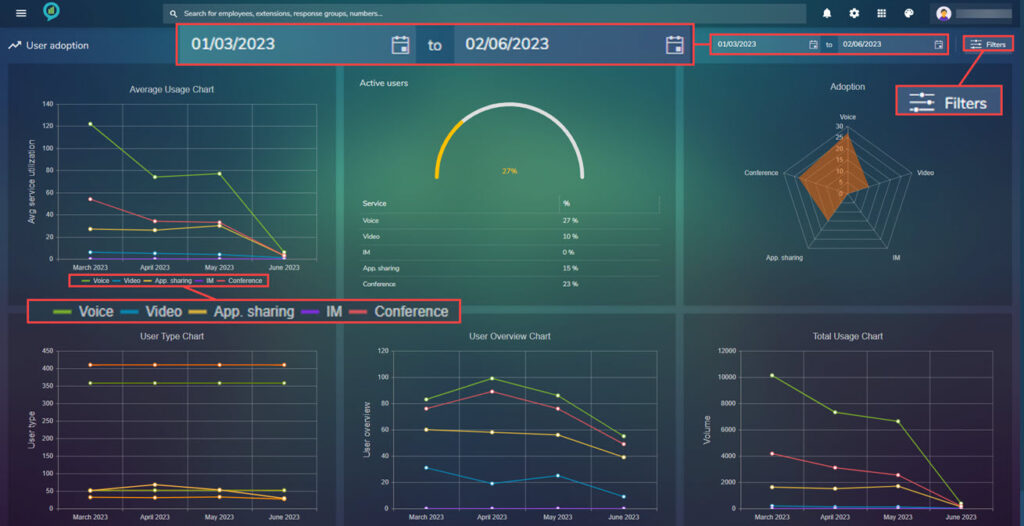
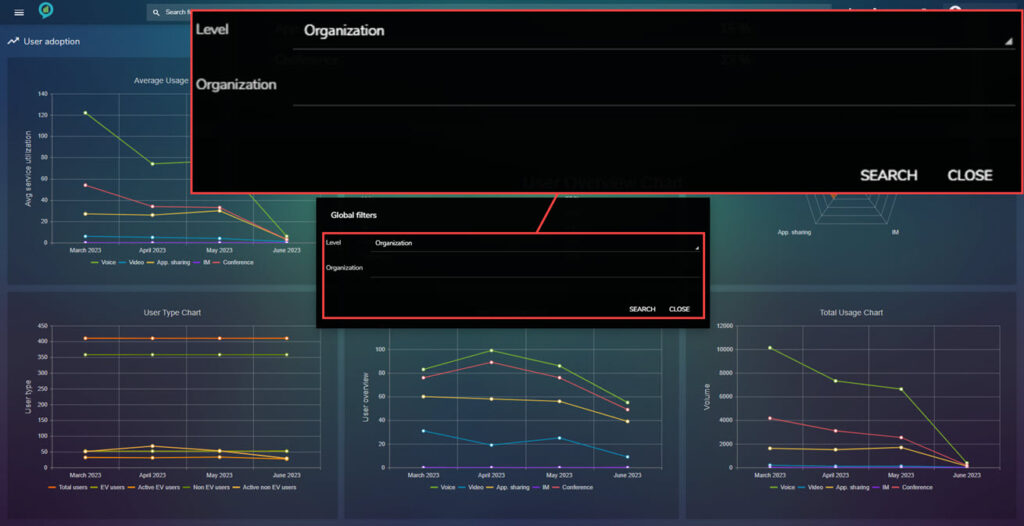
The filters in here are:
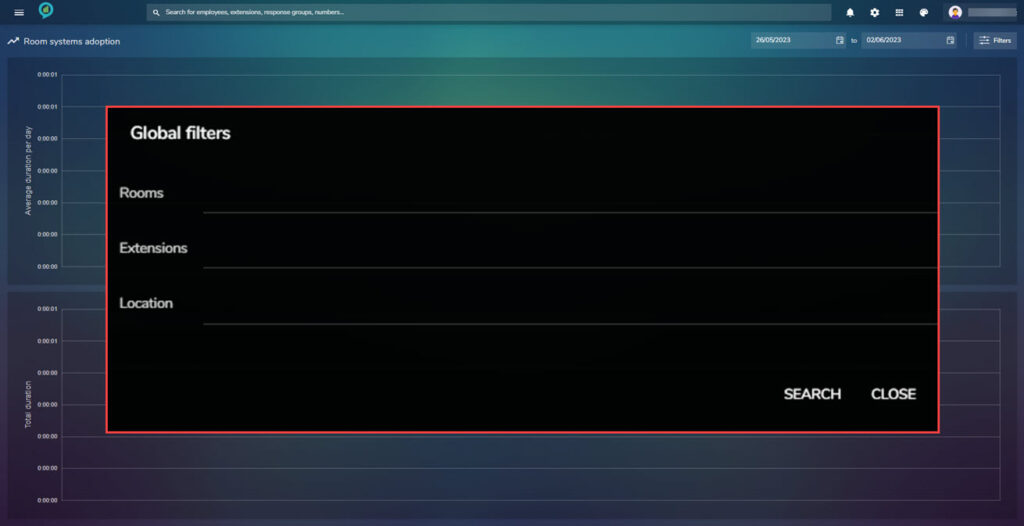
Room systems
This report will give the data for any Teams Rooms:
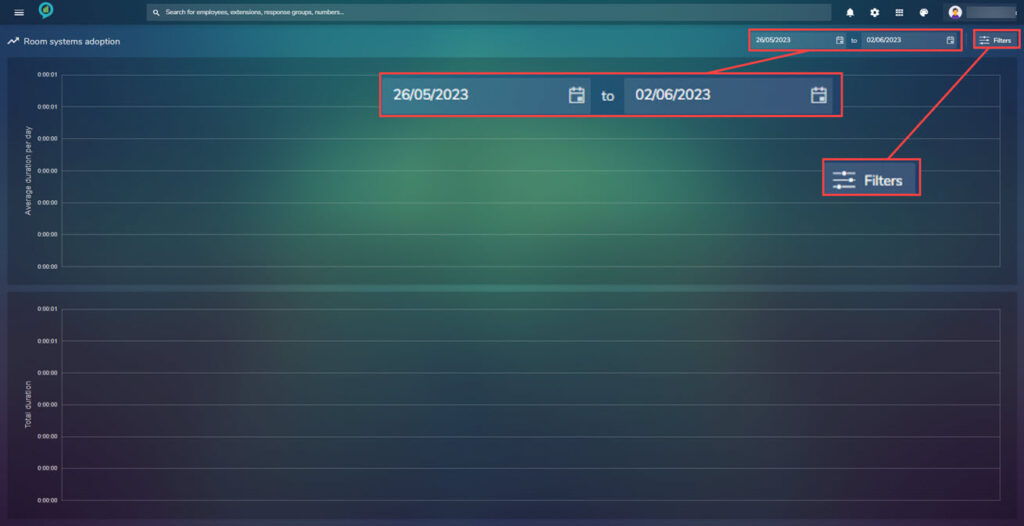
Again with this there is a filter option containing: Rooms, Extensions and Locations:
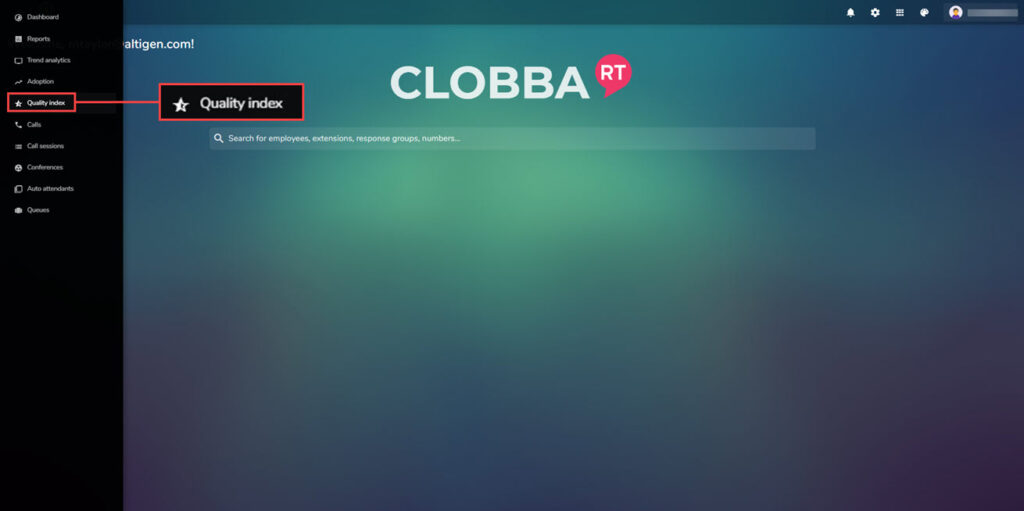
Quality index
Going back to the menu selection click on Quality index:
The below is the view of the left side of the screen where the Thresholds can be set for the report:
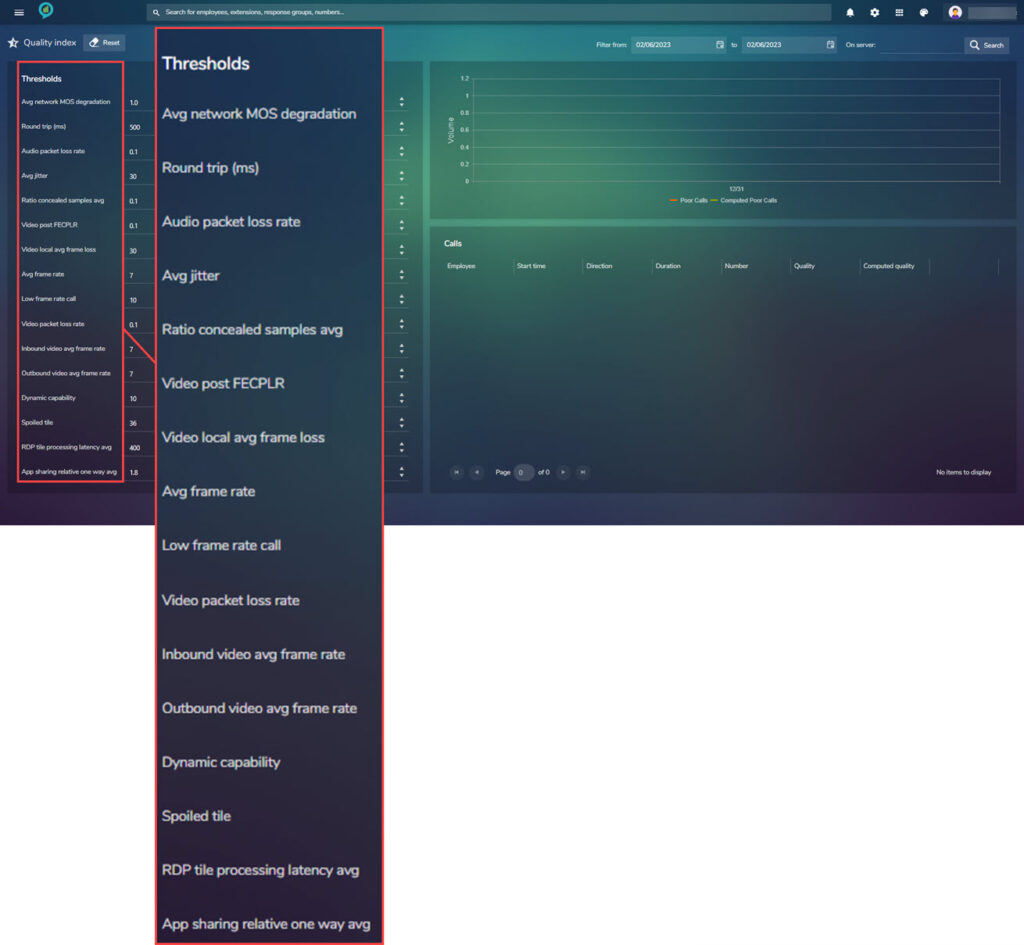
The right side of the screen is the data report view:
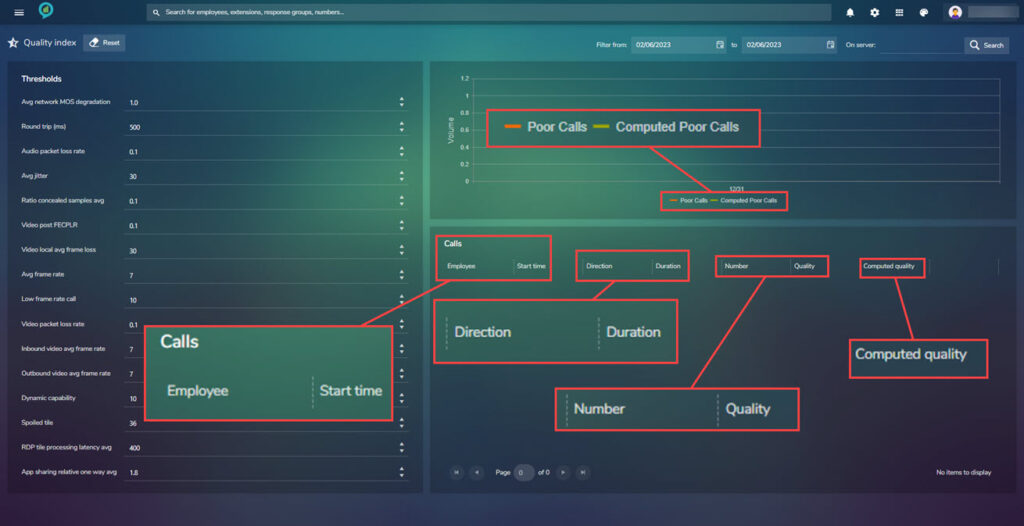
The quality index is built specifically for Teams users who want to identify the good and poor-quality calls not only relying on the MS defined criteria but, also being allowed to give their own opinion on good or poor-quality calls. There is the the ability to view both the MS call quality against a users defined quality.
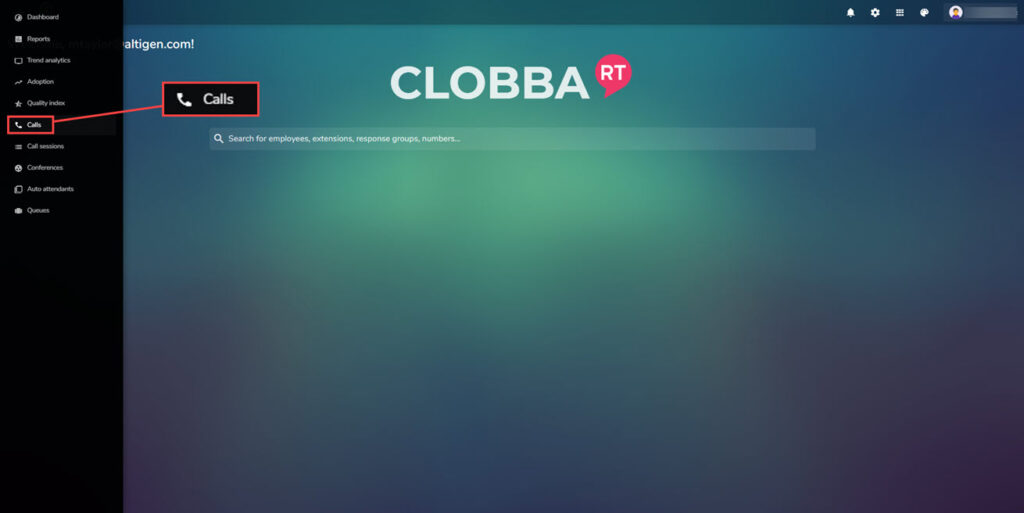
Calls
Access the calls section by clicking on the menu then selecting Calls:
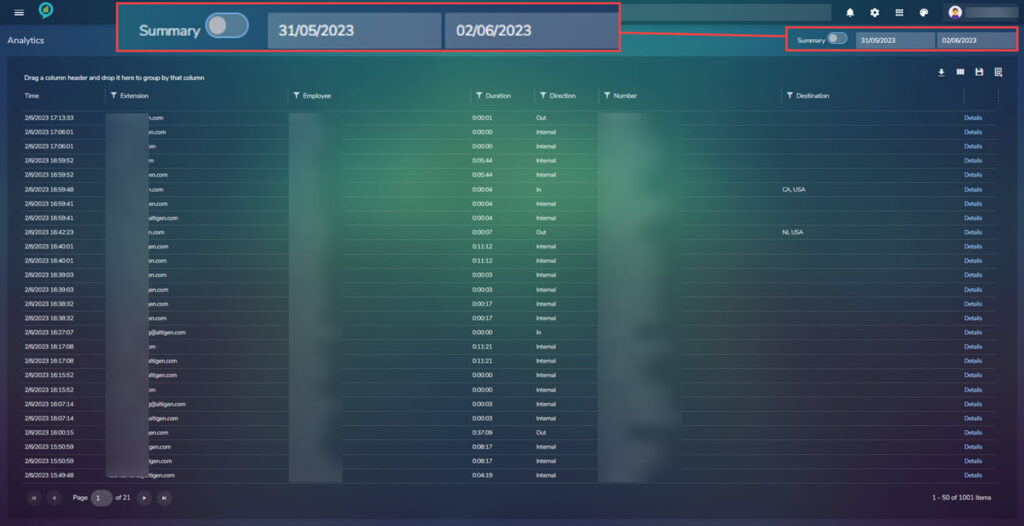
Analytics
Calls sections displays a list with all the calls, in a detailed format for the last 7 days. Dates can be defined in the top right side of the report. The information can be further filtered by clicking on any of the filter icons:
The columns have filter options:
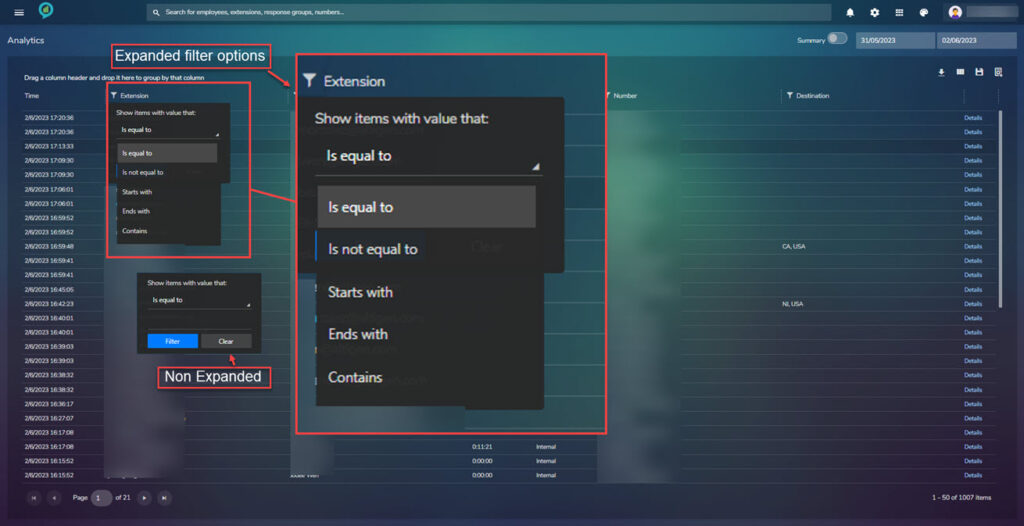
Each option contains a drop down and a text box. Extension, Number and Destination all contain the same filter options.
Duration has an option for:
- Is greater than.
- Is less than.
- Is equal to.
Direction contains the following filter options:
- Select All.
- Outgoing.
- Incoming.
- Internal.
Other column options may have different filter options.
In the top right just below the date selection is a row of icons:
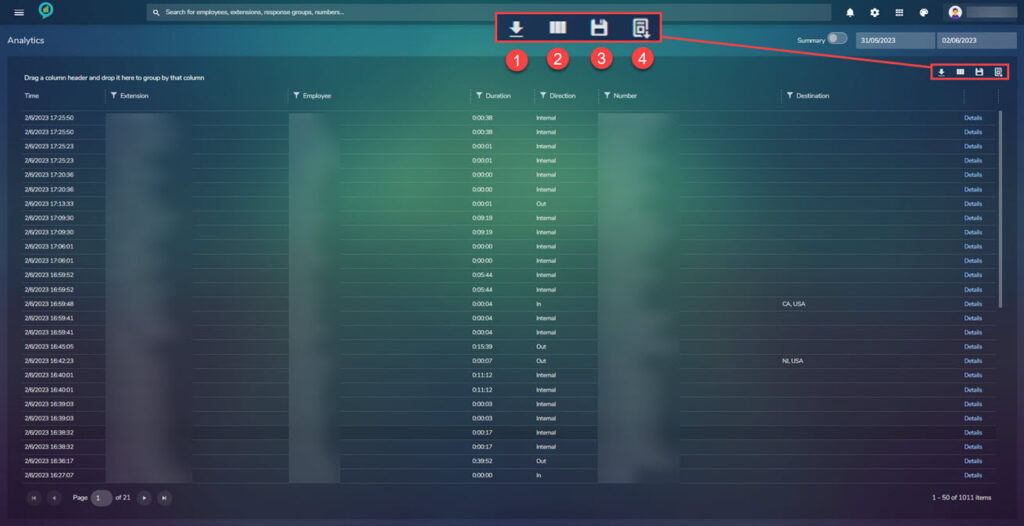
- Download – The file can be downloaded as Excel or Pdf.
- Columns – Opens the below screen of choices:
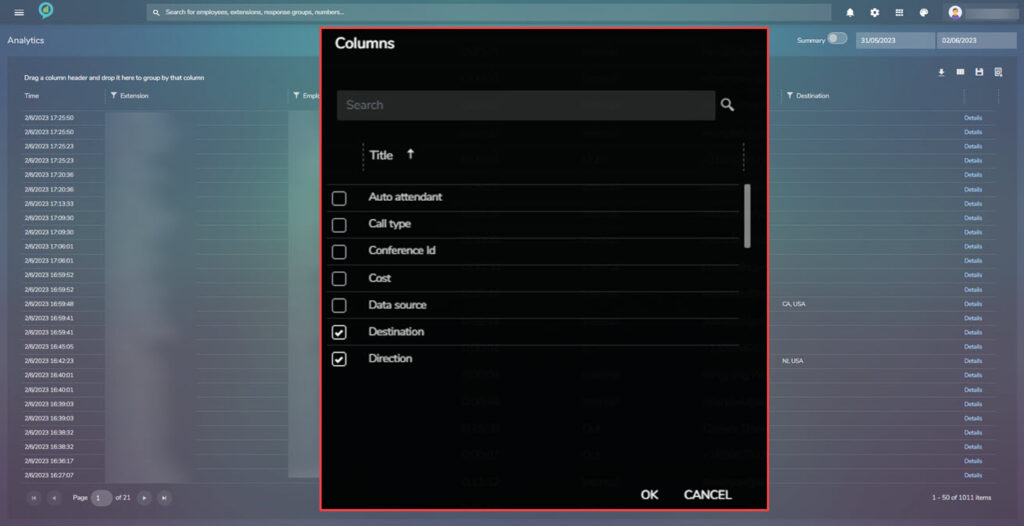
The list can be scrolled through for more options. Check the box next to the column to be included.
- Save – Allows you to save the report.
- Load – Need information
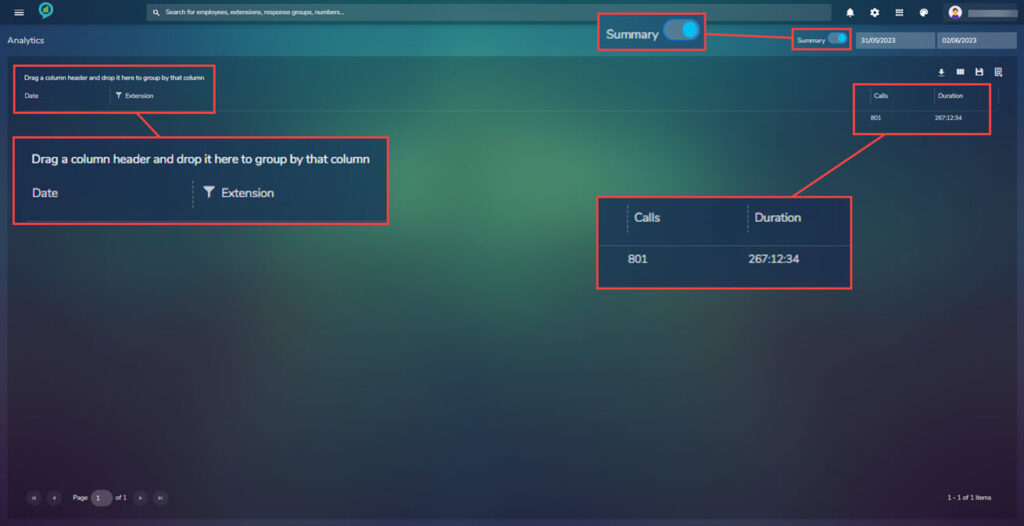
This section also has a summary view, Using the toggle switch to the left of the date boxes the view will change from full to a summary:
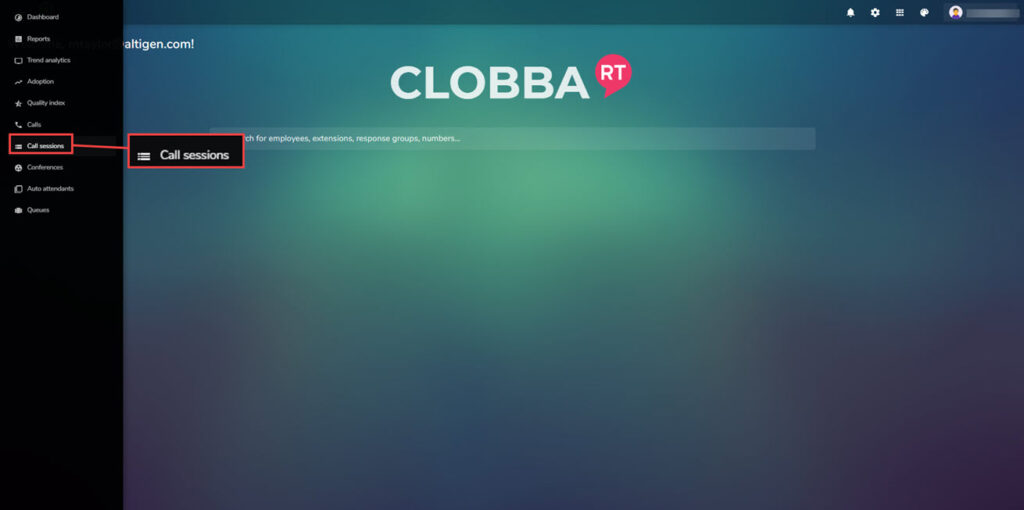
Call Sessions
Access the call session section from the main menu, click on the menu icon then choose call sessions:
This section shows the following totals across the top:
- Total calls.
- Peer-to-peer.
- Conferences.
- Auto Attendants.
- Transfers.
- Outgoing.
- Incoming.
- Internal.
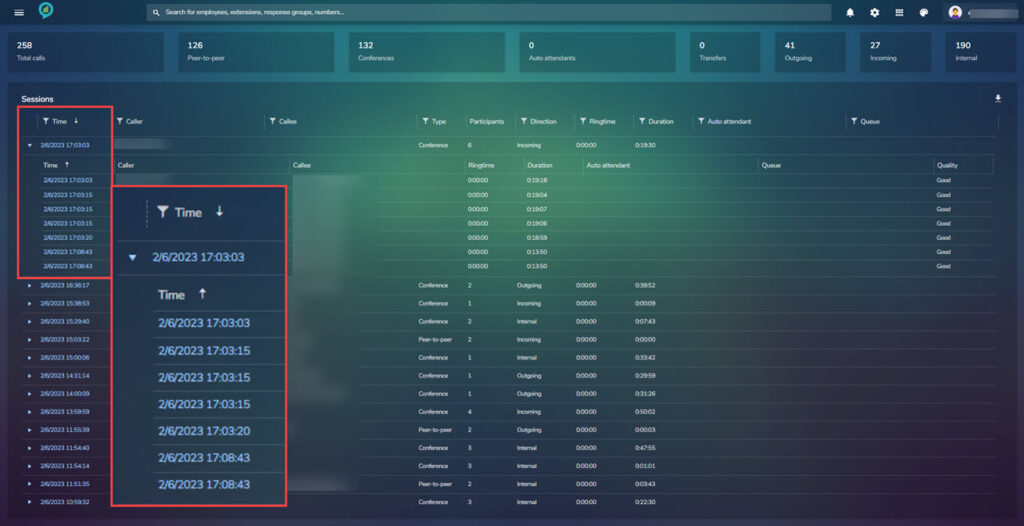
Below this is the sessions, the information in this section can be filtered by column and in the top right is a down arrow that allows the user to down load the report in either Excel or Pdf:
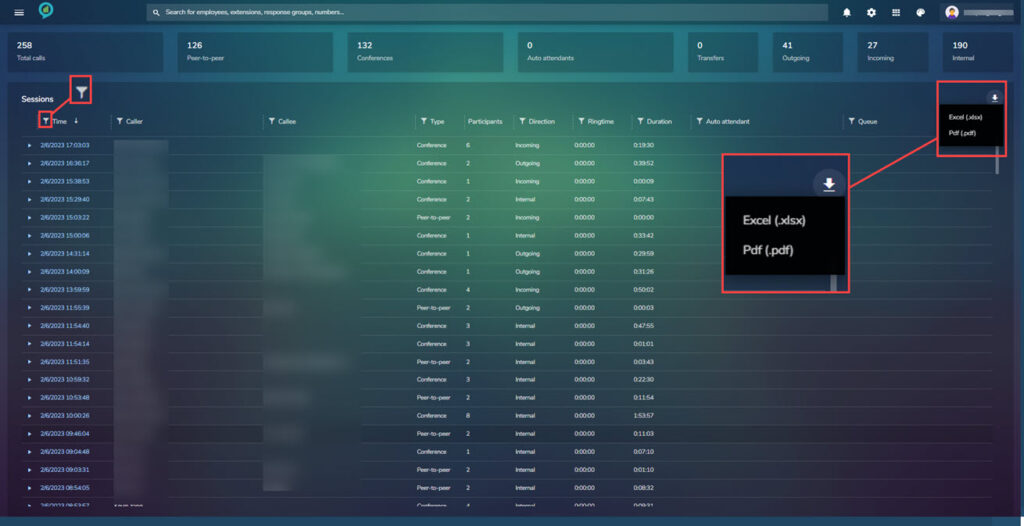
Clicking on the triangle to the left of a lie item opens a more detailed list of the calls made at this time:
Call Types
| A- Abandoned Call | B- Busy Call | X- Transfer Call | F- Forward Call | T- Tandem Call |
| S- Start Leg | E – End Leg | Err- Error Call | C- Conference Call | H- Hold Call |
| Pck- Pickup Call | Icom- Intercom Call | M- Mobility | MHin- Mobility HandIn | MHout- Mobility Handout |
| CPck- Cell Pickup | IVR- IVR Call | Mal- Malicious Call | Brg- Barge Call | Mss- Missed Call |
| Prs- Presented Call | Hg- Hunt Group Call | VM- Voice Mail Call |
These can be combined for example Hg A would be Hunt Group Abandoned Call.
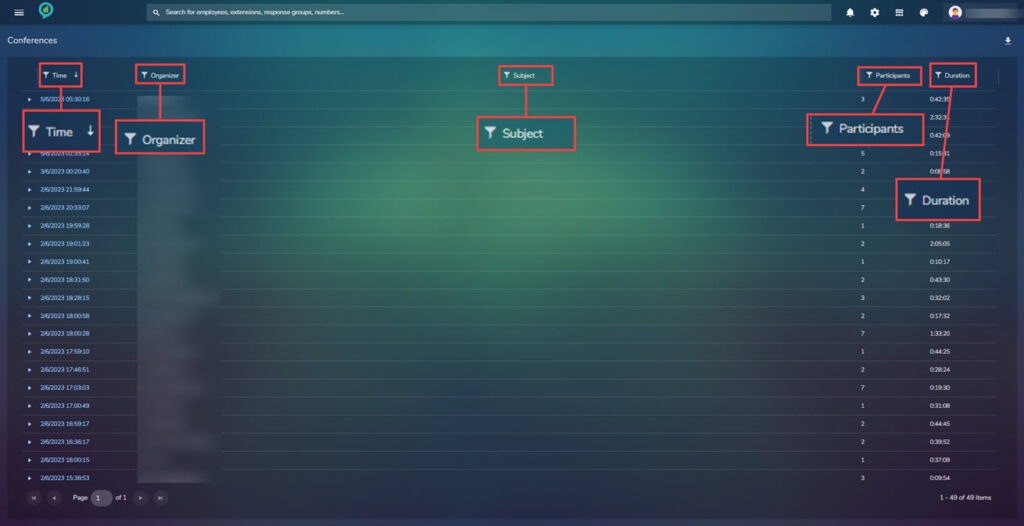
Conferences
Under the conference selection is a view of all conferences starting with the most recent. Displaying: Date and Time, Organizer, Subject, Participants and Duration. The list can be expanded to show a list of participants, service type and quality.
Clicking on an item in the Time list will open the following view, each participant has a line next to their name:
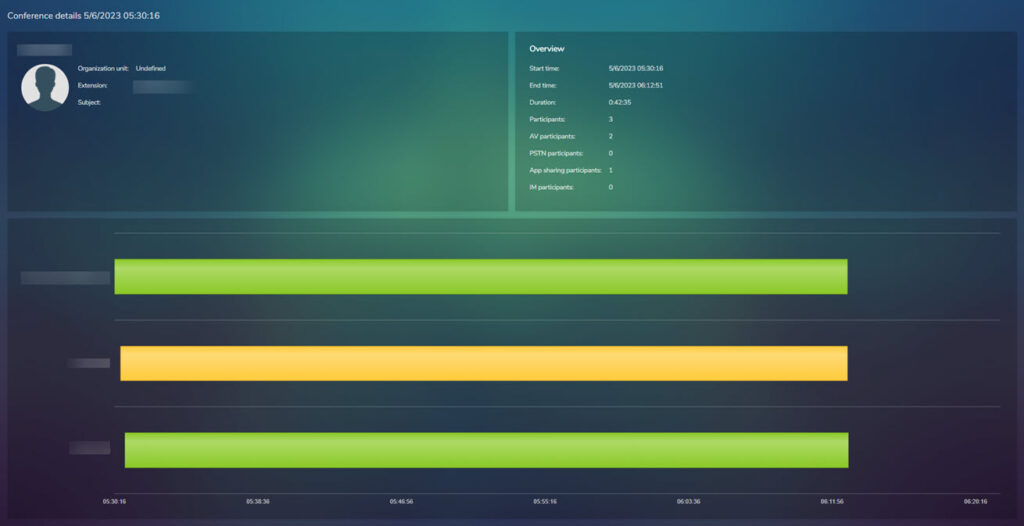
Clicking on any of these lines gives a more detailed view of the call
From this view you can click on any of the stats lines to get a more detailed view:
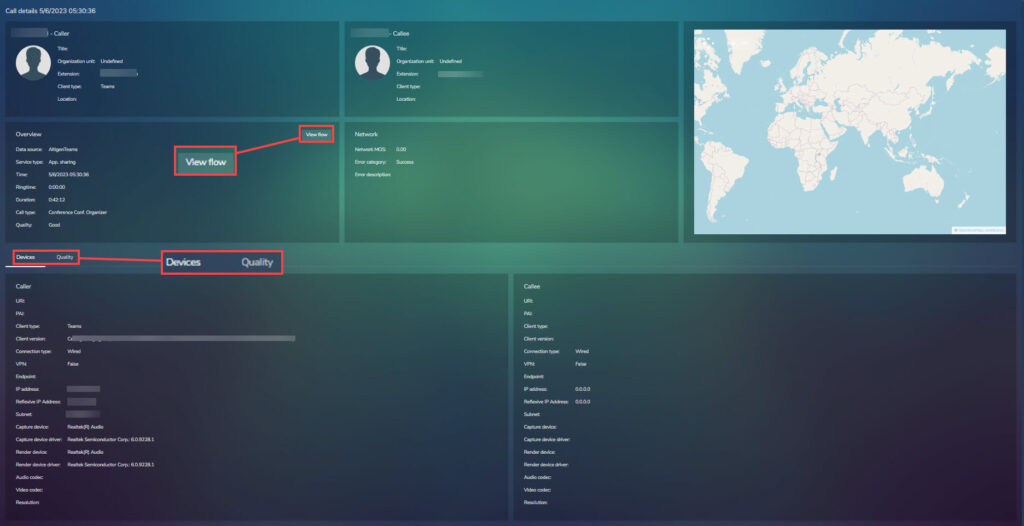
Clicking on the View Flow button returns to the previous view with the conference details.
Devices options shows the device used, the below screen shot shows just the bottom part of the page to give a better view of the devices information:
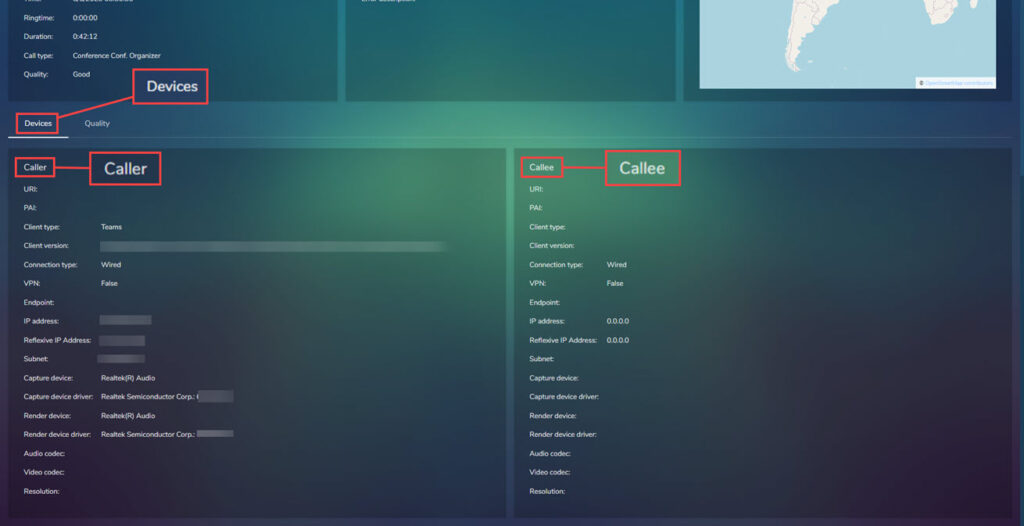
Quality shows the statistics of the call, broken down by caller and callee. Caller is shown in the left hand columns and callee in the right.
Each column has the following sections:
- Audio.
- Video.
- App.Sharing.
- Conversation.
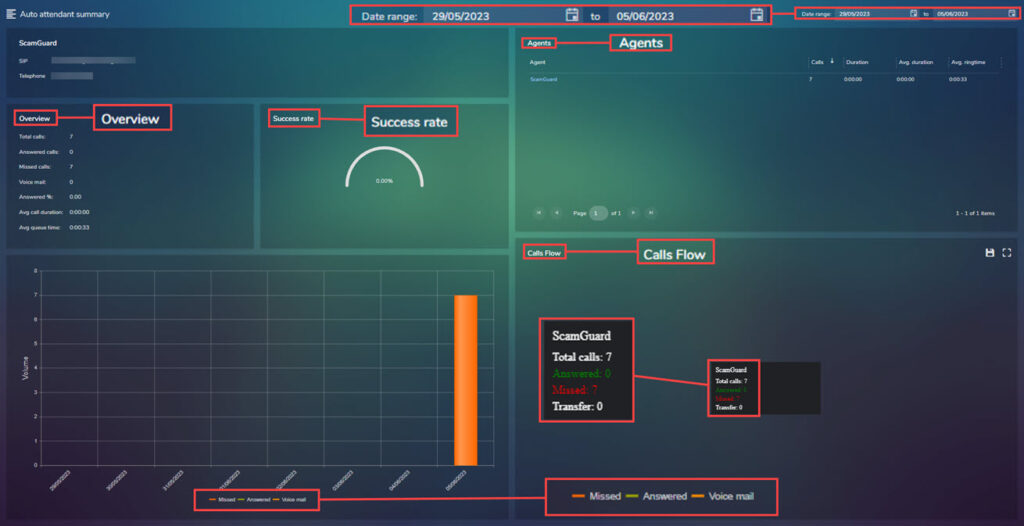
Auto Attendants
A quick view of data collected from Auto Attendants. This can be filtered by date.
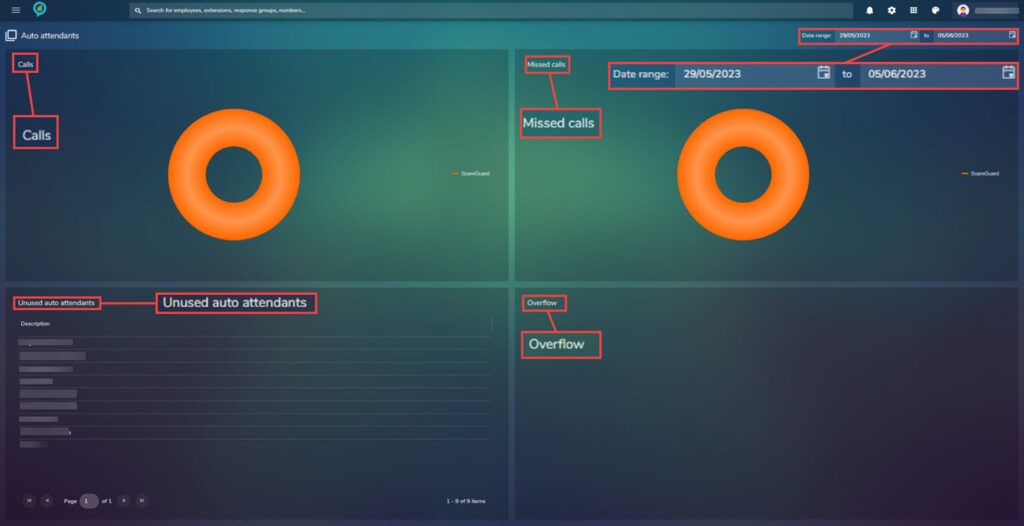
Both calls and missed calls will open more information when clicked.
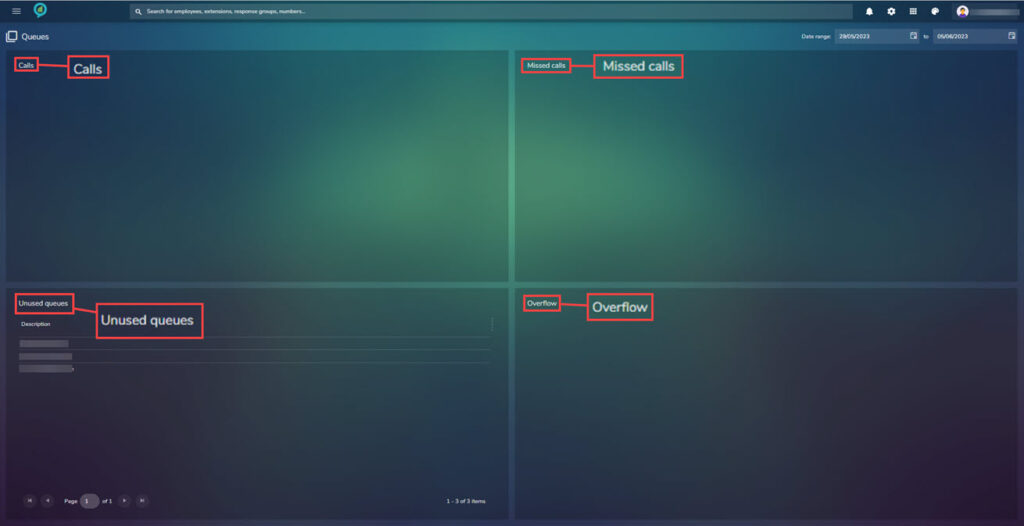
Queues
If call queues are set up the information will show in here:
Glossary
| Rates | |
|---|---|
| Carrier – | The name of the company which provides telecommunication services. |
| Cost – | Cost of the services provided by telecommunication entity. |
| Cost 2 – | Cost of the services provided by telecommunication entity. |
| Destination Type – | Can be set up as international, international-Mobile, Local or can be personalized. |
| Call Details | |
|---|---|
| Account – | … |
| Call Id – | A unique identifier for every call. |
| Call Type – | Call type name abbreviated. |
| Call Type Name – | Type of call, such as; Abandoned, Busy, Conference. |
| Channel – | A gateway can have more channels. |
| Conf. Organizer – | The SIP address of the conference organizer. |
| Conference ID – | An identifier which allows you to follow the call chain. |
| **Data Source – | The set up and configuration method of collecting CDR’s from skype for business** |
| Date – | Date the call took place. |
| Day – | Day of the call. |
| Dialled Number – | Depending on context this field can either be the external number that is dialling in (CLID) or the number dialled by the user. |
| Direction – | Defines if the call was incoming, outgoing or internal. |
| Duration – | Duration of the call from pick up to end. |
| Extension – | Extension number. |
| Extension Type – | Could be Cell, phone, fax or SIP. |
| Extra String 1, 2 or 3 – | Personalized parameters can be added. |
| Gateway – | This is a networking node that connects two networks using different protocols together. |
| Referred By – | A field in CDRs where information is contained regarding the call chain, usually the extension that passed the call via a transfer. |
| Ring Time – | Total time call was ringing prior to connection or disconnection. |
| Service Type – | This is the call modality (IM, App share, Voice, Video, Data) |
| Time – | The time the call took place. |
| Call Types | |
|---|---|
| Is app. Sharing – | If the users are sharing their screens it will show ‘Y’ |
| In conference – | ‘Y’ will appear in the column if the call is a conference call or ‘N’ if it is not. |
| Is Federated – | ‘Y’ will show in the column if the call is federated or ‘N’ if it is not. |
| Is File Transfer – | ‘Y’ will show in the column if the call contains file transfer. |
| **Is Response Group – | ‘Y’ will show in the column if the call is a response group or ‘N’ if it is not.** |
| Destination | |
|---|---|
| Location – | The geographical location the call came from. Phone- The location based on the dialled number. Phone Group – A group of destinations. |
| Region – | Continents. |
| Employee | |
|---|---|
| Employee – | Name and SIP address of the employee. Employees First Name – Users first name. |
| Employee ID – | Users SIP address. Employee Last Name – Users last name. |
| Employee Name – | Users first and last name. |
| Extension Location – | Location of the extension from which the call was made. |
| Hierarchy | |
|---|---|
| Ancestor Unit – | In multi level hierarchy, i.e. Company -> Town -> Department -> Employee (ancestor unit of the employee is town and organization unit is Department) |
| Organization Unit – | Assigned department within organization. |
| IP Fields | |
|---|---|
| Connection Type – | Connection type being used, i.e. Ethernet, Wi-Fi, Wired. |
| Dest. Audio Codec – | Is a codec (a device or program capable of encoding or decoding a digital data stream) that encodes or decodes audio. |
| Dest. Video Codec – | An electronic circuit or software that compresses or decompresses digital video. It converts uncompressed video to a compressed format or vice versa. |
| Destination IP – | Internet protocol address is a numerical label of the recipient, assigned to each device connected to a computer network that uses the Internet Protocol for communication. |
| Destination IP v6 – | The most recent version of the Internet Protocol (IP) the communications protocol that provides an identification and location system for computers on networks and routes traffic across the internet. |
| From Reflective Local IP – | Reflexive local IP contain condition statements (entries) that define criteria for permitting IP packets. |
| Jitter – | Measures the variability of packet delay and results in a distorted or choppy audio experience. Jitter can create latency on networks. |
| Packets – | A network packet is a formatted unit of data carried by a packet-switched network. |
| Latency – | Is a time interval between the stimulation and response, or, from a more general point of view, a time delay between the cause and the effect of some physical change in the system being observed. |
| MOS – | Mean Opinion Score – is the gold standard measurement to gauge the percieved audio quality. Can be between 1 and 5: 1. (Bad) 2. (Poor) 3. (Fair) 4. (Good) 5. (Excellent) |
| Octec – | This is a unit of digital information in computing and telecommunications that consists of eight bits. The term is often used when the term byte may be ambiguous, as the byte has historically been used for storage units of a variety of sizes. |
| Octects Received – | Amount of received Octets. |
| Octets Sent – | Number of Octets sent. |
| Orig. Audio Codec – | This is a codec (a device or computer program capable of encoding or decoding a digital data stream) that encodes or decodes audio. |
| Orig. Video Codec – | This is an electronic circuit or software that compresses or decompresses digital video. It converts uncompressed video to a compressed format and vice versa. |
| Originator IP – | Internet Protocol address is a numerical label of the remitter, assigned to each device connected to a computer network that uses the Internet Protocol for communication. |
| Originator IPv6 – | This is the most recent version of the Internet Protocol (IP) the communication protocol that provides an identification and location system for computers on networks and routes traffic across the internet. |
| Packets Lost – | Packet Loss (%) represents the % of packets that did not make it to their destination, packet loss will cause the audio to be distorted or missing (on the receiver end) |
| Packets Received – | Amount of received packets. |
| Packets Sent – | The amount of sent packets. |
| Pool – | A set of resources that are kept ready to use, rather than acquired on use and released afterwards. |
| Quality – | An international standard, developed by Virtual Socket Interface Alliance for measuring IP or SIP quality and examining the practices used to design, integrate and support the SIP. |
| Server – | A computer program or a device that provides functionality for other programs or devices, called “clients2. These can be wither physical or virtual machines. |
| SIP Response Code – | A signalling protocol used to control communication sessions such as Voice over IP calls. SIP is based around request/response transactions, in a similar manner to the Hypertext Transfer Protocol (HTTP). Each transaction consists of a SIP request and at least one response. |
| Subnet – | A logical subdivision of an IP network. The practice of dividing a network into two or more networks is called subnetting. |
| Subnet Location – | Location of the subnet. |
| To Reflexive Local IP – | Reflexive local IP contain condition statements (entries) that define criteria for permitting IP packets. |
| VPN – | A virtual private network extends a private network across a public network, enabling users to send and receive data across shared or public networks as if their computing devices were directly connected to the private network. |
| Teams | |
|---|---|
| App.Sh.Avg.jitter – | Measures the variability of packet delay and results in a distorted or choppy audio experience. Jitter can increase latency on networks. |
| Avg.Net MOS – | Network MOS is a prediction of the wideband Listening Quality Mean Opinion Score (MOS-LQ) of audio that is played to the user. This value takes into consideration only network factors such as codec used, packet loss, packet reorder, packet errors and jitter. |
| Call Admission Control – | Prevents oversubscription of VoIP networks . It is used in the call set-up phase and applies to real-time media traffic as opposed to data traffic. |
| Callee – | The agent/ employee/ user receiving the call |
| Callee App. Sh. Relative one-way Avg. – | Optimal value for the relative one-way delay between the two media endpoints involved in the application sharing. This is a single-hop latency measure. |
| Callee App. Sharing Bandwidth (Kbps) – | This is a type of resource allocation designed to model the real-world allocation of bandwidth to many users in a network. |
| Callee Audio Bandwidth (Kbps) – | This refers to the frequency range a device can carry without degrading any of the information. It’s also used in digital communication to show how much information something can transfer over a given time. |
| Callee Audio Packets Lost Rate – | Packet Loss (%) represents the % of packets that did not make it to their destination. Packet loss will cause the audio to be distorted or missing (on the receiver end) |
| Callee Audio Round Trip – | Is the most common measure of latency and is measured in ms. |
| Callee Avg. Jitter – | Measures the variability of packet delay and results in a distorted or choppy audio experience on the receiving end. |
| Callee Avg. Listening MOS – | A prediction of the wideband Listening Quality (MOS-LQ) of the audio stream that is played to the user. |
| Callee Avg. MOS – | Average means opinion score. |
| Callee Avg. Net MOS Degradation – | Network MOS Degradation for the whole call. This metric shows the amount the Network MOS was reduced because of jitter and packet loss. |
| Callee Avg. Sending MOS – | Is a prediction of the wideband Listening Quality Mean Opinion Score (MOS-LG) of the audio stream that is being sent from the user. This value takes into consideration the speech and noise levels of the user along with any distortions, and from this data predicts how a large group of users would rate the audio quality they hear. |
| Callee Client Type – | Client type. |
| Callee Client Version– | Client version |
| Callee Conv. MOS – | Is a prediction of the narrowband Conversational Quality (MOS-CQ) of the audio stream that is played to the user. This value takes into consideration the listening quality of the audio played and sent across the network, the speech and noise levels for both audio streams, and echoes. It represents how a large group of people would rate the quality of the connection for holding a conversation. |
| Callee Dynamic Capability % – | Percentage of the call where the client experienced high CPU load when processing video. |
| Callee Echo Mic In – | Echo that was present in the microphone. Typically, you will see low values for headsets or handsets, and higher values for speaker phones or stand alone speakers. |
| Callee Echo Send – | Echo transmitted to other users on the call. |
| Callee End Point – | Is a device or node that is connected to the LAN or WAN and accepts communications back and forth across the network. |
| Callee Inbound Video Frame Rate Avg. – | The average video frame rate received during the call. |
| Callee Low Frame Rate Call % – | Percentage of low frame rate call. |
| Callee Low Network BW – | Is the minimum rate of data transfer across a given path. Bandwidth may be characterised as network bandwidth, data bandwidth or digital bandwidth. |
| Callee Max Jitter – | Measures the maximum variability of packet delay and results in a distorted or choppy audio experience. |
| Callee Max Net MOS Degradation – | This metric shows the maximum amount the network MOS that was reduced because of a jitter and packet loss. |
| Callee MIC. Not Functioning – | Calls in which the capture device was not functioning at an acceptable level. A high value suggests that quality issues with the call were primarily due to the capture device not working as expected. |
| Callee Min Net MOS– | This metric shows the minimum amount the network MOS was reduced because of jitter and packet loss. |
| Callee Near End To Echo – | Used in telephony to improve voice quality by preventing echo from being created or removing it after it is already present. |
| Callee Network Connection – | Network connection. |
| Callee Outbound Video Frame Rate Avg. – | The average video frame rate sent during the call. |
| Callee PAI – | P-Asserted-Identity |
| Callee Ratio Concealed Samples Avg. – | Concealing audio samples is a technique used to deal with dropped network packets. |
| Callee RDP Tile Processing Latency Avg. – | Acceptable value of the average RDP tile processing latency in the AS Conference Server over the duration of the viewing session. |
| Callee Recv. Frame Rate Avg. – | Average video frame rate used by the receiver. |
| Callee Render Device- | Device (Example: Headset, speakers…) used for receiving audio. |
| Callee Spk. Not Functioning – | Calls in which the render device was not functioning at an acceptable level. A high value suggests that quality issues with the call were primarily due to the render device not working as expected. |
| Callee Spoiled Tile % Total – | Total percentage of spoiled RDP tiles. |
| Callee Subnet – | The subnet the callee resides on . |
| Callee URI – | A Uniform Resource Identifier is a string of characters used to identify a resource. |
| Callee Video Avg. Jitter – | Average Jitter in video calls. |
| Callee Video Bandwidth (Kbps) – | Video calls bandwidth. |
| Callee Video Local Frame Loss % Avg. – | The percentage of total video frames that are lost. |
| Callee Video Packets Loss Rate – | The packet loss rate for video calls. |
| Callee Video Post FECPLR – | The packet loss rate after forward error correction has been applied. |
| Callee Video Round Trip – | Round trip time for video calls. |
| Callee Voice Switch – | Calls which had to be placed into half duplex mode. In half duplex mode, communication can travel in only one direction at a given time. |
| Callee VPN – | A virtual private network extends a private across a public network and enables users to send and receive data across shared or public networks as if their computing devices were directly connected to the private network. |
| Caller – | The agent/ employee/ person making the call. |
| Caller App, Sh. Relative Onc-Way Avg. – | Optimal value for the relative one-way delay between the two media endpoints involved in the application sharing. This is a single-hop latency measure. |
| Caller App. Sharing Bandwidth (Kbps) – | This is a type of resource allocation designed to model the real-world allocation of bandwidth to many users in a network. |
| Caller Audio Bandwidth (Kbps) – | This refers to the frequency range a device can carry without degrading any of the information. It’s also used in digital communication to show how much information something can transfer over a given time. |
| Caller Audio Packet Loss Rate – | Packet Loss represents the number of packets that did not make it to their intended destination. Packet loss will cause the audio to be distorted or missing. |
| Caller Audio Round Trip – | Is the most common measure of latency and is measured in MS. |
| Caller Avg. Jitter – | Measures the variability of packet delay and results in a distorted or choppy audio stream that is played to the user. |
| Caller Avg. Listening MOS – | A prediction of the wideband Listening Quality (MOS-LQ) of the audio stream that is played to the user. |
| Caller Avg. MOS – | Average Means Opinion Score. |
| Caller Avg. Net MOS Degradation – | Average network MOS degradation is an integer represents the amount of the MOS value lost to network affects. |
| Caller Avg. Sending MOS – | This is a prediction of the wideband Listening Quality Mean Opinion Score (MOS-LQ) of the audio stream that is being sent from the user. This value takes into consideration the speech and noise levels of the user along with any distortions, and from this data predicts how a large group of users would rate the audio quality they hear |
| Caller Capture Device – | The microphone or recording device used to capture audio. |
| Caller Client Type – | Client type. |
| Caller Client Version– | Client Version. |
| Caller Conv. MOS – | Is a prediction of the narrowband Conversational Quality (MOS-CQ) of the audio stream that is played to the user. This value takes into consideration the listening quality of the audio played and sent across the network, the speech and noise levels for both audio streams, and echoes. It represents how a large group of people would rate the quality of the connection for holding a conversation. |
| Caller Dynamic Capability % – | Percentage of the call where the client experienced high CPU load when processing a video. |
| Caller Echo Mic In – | Echo that was presented in the microphone |
| Caller Echo Send – | Echo transmitted to other users on the call. |
| Caller End Point – | Is a device or node that is connected to the LAN or WAN and accepts communications back and forth across the network. |
| Caller Inbound Video Frame Rate Avg. – | The average video frame rate sent during the call. |
| Caller Low Frame Rate Call % – | Percentage of low frame rate within a call. |
| Caller Low Network BW – | Is the minimum rate of data transfer across a given path. Bandwidth may be characterised as network bandwidth, data bandwidth, or digital bandwidth. |
| Caller Max Net MOS Degradation – | This metric shows the maximum amount the Network MOS that was reduced because of jitter and packet loss. |
| Caller MIC. Not Functioning – | Calls in which the capture device was not functioning at an acceptable level. A high value suggests that quality issues with the call were primarily due to the capture device not working as expected. |
| Caller Min Net MOS– | This metric shows the minimum amount the Network MOS was reduced because of jitter and packet loss. |
| Caller Near End To Echo – | Used in telephony to improve voice quality by preventing echo from being created or removing it after it is already present. |
| Caller Network Connection – | Shows the network the caller connected to the Wired, WIFI, Ethernet etc. |
| Caller Outbound Video Frame Rate Avg. – | The average video frame rate sent during the call. |
| Caller PAI – | P-Asserted-Identity. |
| Caller Ratio Concealed Samples Avg. – | Acceptable value of the average RDP tile processing latency in the AS Conferencing Server over the duration of the viewing session. |
| Caller Recv. Frame Rate Avg. – | Average video frame rate used by the receiver. |
| Caller Render Device– | Device (Example: Headset, Speakers…) used for receiving audio. |
| Caller Spk. Not Functioning – | Calls in which the render device was not functioning at an acceptable level. A high value suggests that quality issues with the call were primarily due to the render device not working as expected. |
| Caller Spoiled Tile % Total – | Total Percentage of spiled RDP tiles. |
| Caller Subnet – | The subnet the caller resides on. |
| Caller URI – | A Uniform Resource Identifier is a string of characters used to identify a resource. |
| Caller Video Avg. Jitter – | Average jitter in video calls. |
| Caller Video bandwidth (Kbps) – | Video calls bandwidth. |
| Caller Video Local Frame Loss % Avg.– | The percentage of total video frames that are lost. |
| Caller Video Packet Loss Rate – | Packet Loss represents the number of packets that did not make it to their intended destination. Packet loss will cause the audio to be distorted or missing. |
| Caller Video Post FECPLR – | The packet loss rate after forward error connection has been applied. |
| Caller Video Round Trip – | This measures the average round trip time for RTP packets between endpoints. When the latency is high, users are likely to hear a delay in the audio. |
| Caller Voice Switch – | Calls which had to be placed into half duplex modes. In half duplex mode, communication can travel in only one direction at a given time. |
| Caller VPN – | A virtual private network extends a private network across a public network and enables users to send and receive data across shared or public networks as if their computing devices were directly connected to the private network. |
| Client Alias – | An alias is an alternate name that can be used to make a connection. The alias encapsulates the required elements of a connection string and exposes them with a name chosen by the user. |
| Client Version – | Version of the client. |
| Diagnostic ID – | This is a unique identifier (in the form or a ms-diagnostics header) that gets attached to a SIP message, while the Diagnostic header provides an accompanying description for the Diagnostic ID. |
| Disconnected By Phone – | The connection was interrupted due to phone issues. |
| Disconnected By User – | The connection was interrupted due to user issues. |
| Error Category – | Type of error that occurred. |
| HD Quality – | High definition quality. |
| NMOS Degradation (Jitter) – | Network MOS Degradation for the complete call. This metric shows the amount the Network MOS was reduced because of jitter. |
| NMOS Degradation (Packet Loss) – | Network MOS Degradation for the complete call. This metric shows the amount the Network MOS was reduced because of jitter. |
| Pool – | Is a set of resources that are kept ready to use, rather than acquired on use and released afterwards |
| Ratio Compressed Samples Avg. – | Quantify the reduction in data-representation size of produced by a data compression algorithm. |
| Server – | Is a computer program or a device that provides functionality for other programs or devices, called “clients”. |
| Video Allocated Bandwidth – | The amount of bandwidth that is allocated for video calls. |
| Video Resolution – | Resolution of video calls. |
| Auto Attendants/ Call Queues | |
|---|---|
| Queue Name – | Name of the queue. |
| AA/ Call Queue Description – | Description of the aa or call queue. |
| SIP Address – | Email address used to configure Teams. |
| Telephone – | Telephone. |
| Summery | |
|---|---|
| Callee NMOS Degradation – | Network MOS Degradation for the whole call. This metric shows the amount the network MOS was reduced because of jitter and packet loss. |
| Calls * – | Outbound (out to PSTN/ inbound (incoming from PSTN) / internal calls (internal calls between teams users). |
| Cost * – | Rate associated with making or receiving calls. |
| Cost 2* – | Rate associated with making or receiving calls. |
| Duration * – | Total time call was live. Picked up (connected)-> Hung up (disconnected). |
| Extensions * – | Extension number. |
| Jitter * – | Measures the variability of packet delay and results in a distorted or choppy audio experience. Jitter can increase latency on networks. |
| MOS * – | Mean Opinion Score – is the gold standard measurement to gauge the perceived audio quality. Can be between 1 and 5: 1 – Bad 2 – Poor 3 – Fair 4 – Good 5 – Excellent |
| Ring Time * – | Total time call rang for. |
| Time * – | Time the call took place. |
| Report Builder General | |
|---|---|
| Date – | Can be set for a specific day or range. |
| Time – | Can be set for a specific time or range. |
| Duration – | The elapsed time between answer and disconnect. |
| Ring Time – | Total time call rang before connection or disconnection. |
| Cost – | Cost of the services provided by telecommunications entity. |
| Direction – | Defines whether or not the call was incoming, outgoing or internal. |
| Incoming – | A call that is coming into the organization. |
| Outbound – | An outgoing call from a user. |
| Internal – | A call between users within the same organization. |
| Service Type – | This is the call modality (IM/ App share/ Voice/ Video/ Data) |
| Voice – | Audio Calls. |
| Video – | Video calls. |
| App. Sharing – | Sharing screen during a Teams call or conference. |
| IM – | Instant messages between Teams users. |
| Data – | Files transferred between Teams users, |
| Call Types | |
|---|---|
| Abandoned- | The caller hung up the call without being answered. Duration of the call is 0 and ring time reflects the amount of time the call was being presented. |
| Start – | For an internal call, Teams will generate 2 call detail records (CDR’s), start leg has caller extension in Extension column and callee extension will be in CLID column. |
| Transfer – | Agent picks up call and transfers it out to another agent or department. |
| Conference – | A service feature that allows a call to be established among three or more stations in such a manner that each of the station is able to communicate with all the other stations |
| Pick up – | CISCO |
| Tandem – | i.e. A call comes in outside of working hours. The system can be set up to send the call to an external user or number. In the system it will appear as one incoming call and one outgoing call. |
| Presented – | A call that has ran to an individual agent. |
| File Transfer- | Files, documents or any data transferred through Teams. |
| Transfer Out- | Transferred call out to the PSTN. |
| Busy – | The system closed the call depending on the configuration, i.e. Call time out, lack of voicemail or overflow system. |
| End – | For an internal call, Teams will generate 2 call detail records (CDR’s), start leg has caller extension in Extension column and callee extension will be in CLID column. |
| Forward – | A call which is forwarded to another employee, department etc, action is done via an automatic system such as call queues. |
| Auto Attendant/ Call Queue – | This is a feature that lets managers or server administrators route and queue incoming calls to groups of people, called agents, such as for a help desk or a customer service desk. |
| Voice Mail – | A method of storing voice messages electronically for later retrieval by intended recipients. |
| Personal – | Calls identified for a personal purpose. |
| Error – | A call which is identified as inaccurate or incorrect. |
| Scheduled – | A call set for a specific time. |
| Organization Structure | |
|---|---|
| Organization Structure – | The way in which employees/ departments /teams are set up in AD. |
| Extension – | Extension number (cellular/ fax/ phone/ SIP) |
| Location – | Geographical location the call came from. |
| Referred By – | A field in CDRs that contains information regarding the call chain, normally the extension that passed the call via a transfer. |
| Employee – | Name and SIP address of the employee. |
| Department – | A subset or team of users within the organization. |
| Destination | |
|---|---|
| Dialled Number/ CLID – | The number that the user called out to. Destinations – the location/ destination on the call, based on phone directory. |
| Destination Types – | Can be international, national, international mobile. |
| IP Fields | |
|---|---|
| Originator IP – | Internet protocol address is a numerical label of the remitter, assigned to each device connected to a computer network that uses the Internet Protocol for communication. |
| Destination IP – | Internet protocol address is a numerical label of the recipient, assigned to each device connected to a computer network that uses the Internet Protocol for communication. |
| Subnet – | A subnet (short for “subnetwork”) is an identifiably separate part of an organization’s network. Typically, a subnet may represent all the machines at one geographic location, in one building, or on the same local area network (LAN) |
| Subnet Locations – | Location of subnet. |
| MOS – | Mean Opinion Score. |
| Quality – | UCA uses the MS methodology of rate calls either GOOD or POOR quality. |
| Connection Type – | How the call was connected between the participants e.g. Wired, Wi-Fi, Mobile broadband, Tunnel. |
| VPN – | Virtual Private Network. |
| Sort and Summary – | Sort and group reports by applying specific filters. |
| Ancestor Unit– | In multilevel hierarchy, i.e. Company -> Town -> Department -> Employee (ancestor unit of the employee is town and organization unit is Department). |
| Call Type – | See call types table. |
| Carrier – | The name of the company that provides the telecommunication services. |
| Channel – | A separate path through which signals can flow. |
| Conference ID- | Each conference is given an individual ID allowing you to follow the call chain. |
| Conference Organizer – | The SIP address of the conference organizer (agent that arranged / Scheduled the conference). |
| Cost – | Cost of the services provided by the telecommunication entity. |
| Data Source – | Set up and configuration method of collecting Call Detail Records (CDRs) from Teams. |
| Date – | The date on which the activity (IM / Voice / Video / Data) took place. |
| Destination IP- | Internet Protocol address is a numerical label of the recipient, assigned to each device connected to a computer network that uses the Internet Protocol for communication. |
| Destination Type – | Can be set as International, International – Mobile, Local or can be personalized based on prefixes. |
| Dialled Number – | The number dialled by the user. |
| Direction – | Shows if the call was incoming, outgoing or internal. |
| Duration – | Total time between the call being picked up and disconnected. |
| Employee – | Name and SIP address of the user / agent. |
| Extension – | Extension number. |
| Extension Location – | Geographical location of extension. |
| Extension Type – | Can be Cellular, Phone, Fax or SIP. |
| Gateway – | A network node that connects two networks using different protocols together. |
| Month – | The calendar month in which the activity took place. |
| Organization Unit – | Assigned department within the company. |
| Phone – | Destination of the call, based on phone directory. |
| Phone Group – | Group of destinations. |
| Queue Name – | The name assigned to a group of employees. |
| Referred By – | A field in CDRs that contains information regarding the call chain, normally the extension that passed the call via transfer. |
| Auto Attendant / Call Queue – | A feature that allows managers or server administrators to route and queue incoming calls to groups of people, called agents, such as for a helpdesk or customer service desk. |
| Ring Time – | Total time call was ringing for before being connected or disconnected. |
| Generate – | Click to produce reports. |
| Schedule Report – | Define a frequency on which you wish the report to run. For example, day, week, month, year. Set the time and recipient. |
| Save – | Save the reports to templates. |
| Clear – | Reset the report builder to the default settings. |