Supervisor view
The role of a supervisor is usually to monitor the contact center operations, mentor and lead agents, assign work, tasks etc. FrontStage offers a number of tools to ensure the monitoring and operational control work with ease. A supervisor can make a call and they can pick up from call queues. It is possible for a supervisor can have both the supervisor view and an agent view running at the same time.
A supervisor will have a different URL to use than for Agent log in. This will be provided by your system Admin.
Agents View
Supervisors will be able to view live statistics for their team.
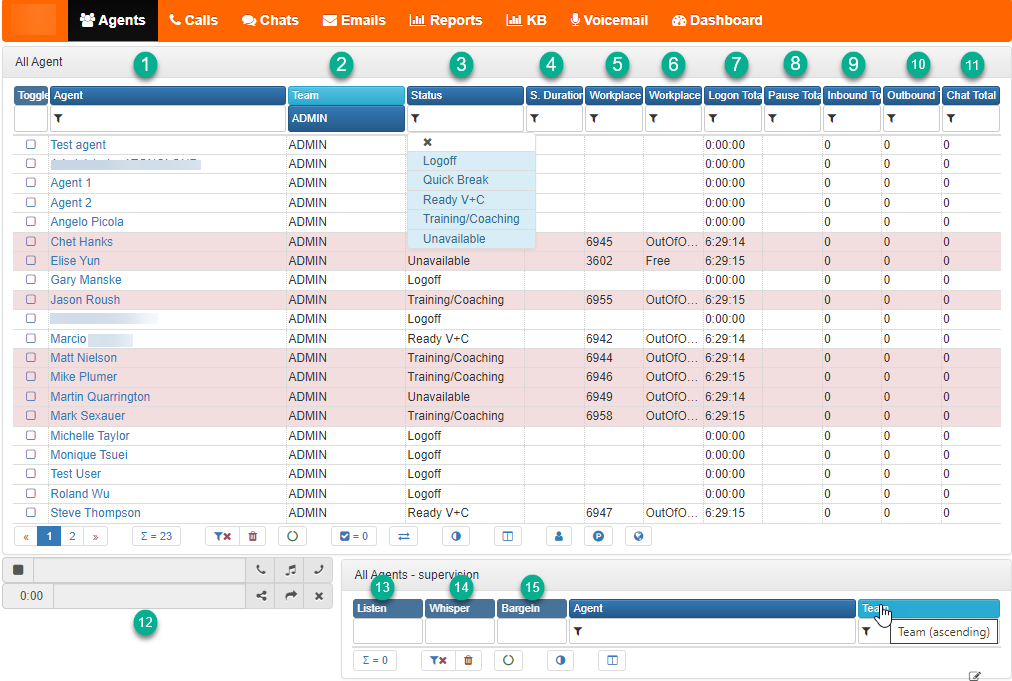
| 1 – Agent | List of agents in the workgroup |
| 2 – Team | Drop down list of available teams |
| 3 – Status | Shows the status of the agents |
| 4 – S. Duration | Gives the time the agent has been in the status |
| 5 – Workplace | Agents extension number |
| 6 – Workplace State | Agents status in workgroup |
| 7 – Logon Total | Total time agent has been logged in |
| 8 – Pause total | Time agent has been paused |
| 9 – Inbound Total | Total of inbound calls taken |
| 10 – Outbound Total | Total number of outbound calls made |
| 11 – Chat Total | Total number of chats for agent |
| 12 – Call Bar | Calls can be made from here by typing in the number |
| 13 – Listen | Allows the supervisor to listen in to the call |
| 14 – Whisper | The supervisor can talk to the agent in a call without the customer hearing them |
| 15 – Barge In | Supervisor can be on the call with the agent and customer if needed |
Clicking on an Agent in will open a window with the following:
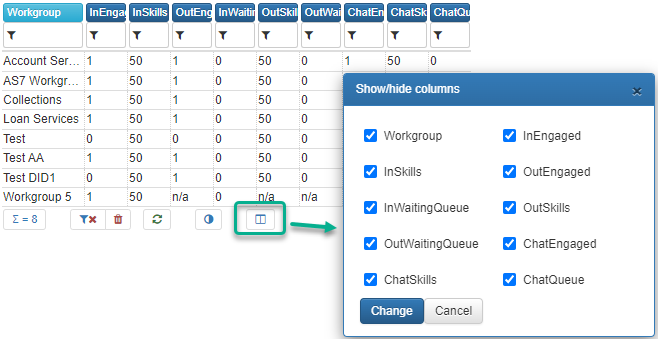
This will show what workgroups the Agent is assigned to and give some statistics for each group they are in. The columns of data can be changed by clicking on the icon shown above this will then open the window where you can remove and add columns.
Calls
The main screen shows a breakdown of Agents but the calls menu will give a list of incoming and outgoing calls. Again as above the filters can be changed by clicking on the button (As shown above). The inbound calls can be filtered by:
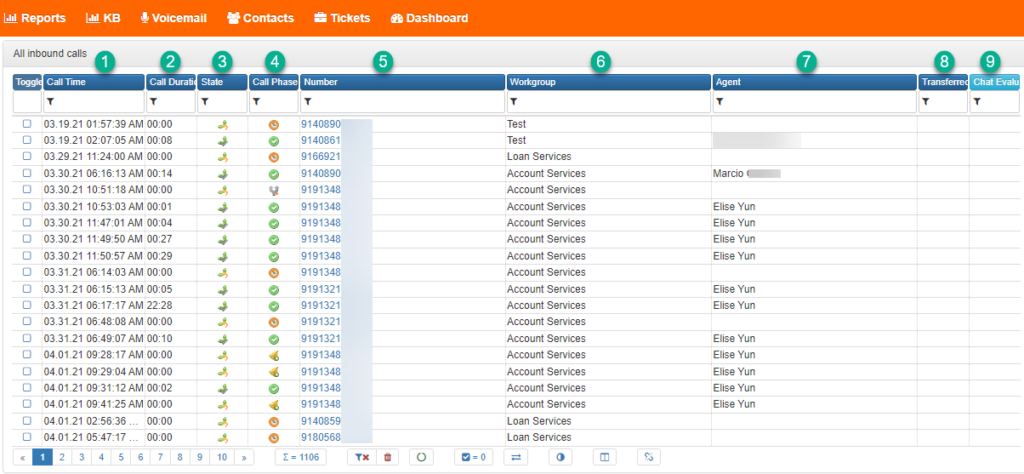
| 1 – Call Time | Time and date of call |
| 2 – Call Duration | Length of call |
| 3 – State | State of call. Example: Served/Lost |
| 4 – Call Phase | Shows the phase the call is in. Example: Wait/Agent Talk |
| 5 – Number | Number the caller is calling from |
| 6 – Workgroup | Name of the workgroup the agent is logged into |
| 7 – Agent | Name of agent |
| 8 – Transferred | Shows if a call has been transferred |
| 9 – Chat Evaluation |
Call Statuses and Phases
Phases and statuses describe a position where the call is located. Each status is further subdivided into phases – A more detailed specification. A phase can be the same for multiple statuses. In short, phases are grouped into statuses, this makes displaying easier in grids, statistics, etc.
Example: An outbound call can be in a status such as, Prepared,Paused, Scheduled Etc. Phases for active are e.g. Agentofferfirst, Agentoffermissed and so on.
Outbound Calls
An ideal outbound call includes the following steps:
Queue or Manual distribution -> offer -> Preview -> Dial -> Conversation -> Result.
The actual progress can be different for each call. An error occurs, Preview is disabled, etc. A pre-condition for call distribution is to be in the ready state. The agent remains in this state from distribution to conversation. They can be automatically switched to the PCP status for the result step.
| Stage | Statuses | Phases |
|---|---|---|
| Before the Call | Prepared – Paused – Scheduled* – Neglected | New – Manual – In Queue – In Queue No Time – In Queue Timed Out – Obsolete |
| During the Call | Active** | Agent Offer First – Agent Offer Missed – Agent Offer Next – Agent Pre Call – Agent Dialing – Agent Talk – Wait For Result |
| After the Call | Completed – Cancelled** – No Answer** – Busy** – To Continue** – Talk Error** – Failed** – No Result | Hang Up Agent*** – Hang Up Called** |
NOTE: * A temporary state or phase. The call will be worked with. For example the Active status needs to be followed by another because the call will eventually end.
** A call in the Cancelled Status can in fact have any phase that indicates when the cancellation occurred.
*** The indication whether it was the called party or the agent who hung up depends on the telephone system capabilities.
Outbound Call Statuses
A more detailed explanation of outbound call statuses. In the database, the statuses correspond to the OutboundCall. CallResult column.

| Status | Description |
|---|---|
| Prepared | Before making a call; The call is not yet to be scheduled. |
| Paused | After/Before call execution/will continue at the administrators request – temporarily suspended, subsequent change only to Scheduled. |
| Scheduled | The call is scheduled before the call is actually made. |
| Neglected | After cancelling the call – The system decided to cancel the call. |
| Active | Call in progress. |
| Completed | After making/completing the call – success. |
| Cancelled | After making/completing the call – The number could not be reached, do not reschedule. |
| NoAnswer | After making the call/to be continued – not answering, reschedule according to rules. |
| Busy | After making the call/to be continued – busy, reschedule according to the rules. |
| ToContinue | After making the call/to be continued – conversation not finished, call again, reschedule according to the rules. |
| TalkError | After making the call/to be continued – wrong person, reschedule according to the rules. |
| Failed | After making the call/to be continued – failed to dial, reschedule according to the rules. |
| NoResult | The time for writing the call result has expired. |
Outbound Call Phases
A more detailed explanation of the outbound call phases. In the phase database, they correspond to the OutboundCall.CallPhase Column.

| Phases | Description |
|---|---|
| New | A newly created call with which nothing has happened so far. |
| Manual | Intentionally ignored by automatic distribution. |
| In Queue | Call queued for automatic distribution. |
| In Queue Timed Out | Call queued because it is no longer in a calid time window (Columns TimeMode, TimeFrom and TimeTo in the OutboundList table) |
| In Queue No Time | The call was not in queue at all because TimeMode/From/To columns does not allow its scheduling. |
| Obsolete | This is a user phase indicating a cancelled call that is no longer needed. |
| Agent Offer First | The call is offered (pop-up) to the first agent. |
| Agent Offer Missed | The call was not accepted by the agent and no other agent currently available. |
| Agent Offer Next | The call is offered (pop-up) to another agent. |
| Agent Pre-Call | Time to prepare for the offered call; the call is dialled only after confirmation by the agent or after a predefined time. |
| Agent Dialling | The call has been received and is being dialled/ringing/waiting for connection. |
| Agent Talk | The call was answered by the called party and conversation is ongoing. |
| Wait For Result | The call ended with the results recorded, whereas the conversation ended already before that. |
| Hang Up Agent | The call ended with the agent hanging up and the result was recorded already before that. |
| Hang Up Called | The call ended with the called party hanging up and the result was recorded already before that. |
Inbound Call
An inbound call is initiated outside the system and cannot be known before it enters execution. Statuses are simpler than with the outbound calls because activities such as scheduling and rescheduling are not required.
The active status contains phases through which the call passes, represented by a phone call at all times. When the call ends, this phase is maintained, which is important especially for lost calls. Phase blocks – marked with letters A and B (before distribution) and W (while waiting) – are essential for the call process.
The ideal flow of an inbound call is also easier:
IVR -> queue -> dialling -> conversation -> result
| State | Status | Phases |
|---|---|---|
| During the Call | Active | Pilot – PhaseAnnouncementA – PhaseIvrScriptA – PhaseAnnouncementB – PhaseIvrScriptB – Distributing – PhaseDispatchQueue – Putting on Waiting – PhaseWaitingQueue – PhaseManualDispatch – PhaseAnnouncementW – PhaseIvrScriptW – PhaseAgentRingFirst – PhaseAgentRingMissed – PhaseAgentRingNext – AgentTalk |
| After the call | Served – Lost | HangupAgent – HangupCaller – TerminatedA – TerminatedB – TerminatedW – TransferredA – TransferredB – TransferredW – Pilot – PhaseAnnouncementA – New |
Inbound Call Statuses
A more detailed explanation of inbound call statuses. In the database, the statuses correspond to InboundCall.CallResult column.

| Status | Description |
|---|---|
| Active | Call in progress. |
| Served | After making a call. |
| Lost | The call gets into this status from any active phase except for the AgentTalk phase. |
Inbound Call Phases
A more detailed explanation of inbound call statuses. In the database, the statuses correspond to the InboundCall.CallResult column.

| Phases | Description |
|---|---|
| Pilot | Call before entering the entry rule, i.e. before the IVR. |
| Phase Announcement A | The announcement played as a part of the entry rule. |
| Phase IVR Script A | The call is processed within the IVR script as a part of the entry rule. |
| Phase Announcement B | The announcement played as a part of the entry rule. |
| Phase IVR Script B | The call is processed within the IVR script as a part of the distribution rule. |
| Distributing | The call is currently being distributed to the agent. It will normally be for a very short time (<300ms) in this phase. If the handover for distribution is not successful within a reasonable time, the call returns to the previous phase. |
| Phase Dispatch Queue | Not used. |
| Putting On Waiting | The call is being transferred to the waiting queue. It will normally be for a very short time (<300ms) in this phase. If the transfer to the waiting queue is not successful within a reasonable time, the call returns to the previous queue. |
| Phase Waiting Queue | Call in the waiting queue. |
| Phase Manual Dispatch | Not Used. |
| Phase Announcement W | The announcement played as a part of the waiting rule. |
| Phase IVR Script W | The call is processed within the IVR script as a part of the waiting rule. |
| Phase Agent Ring First | Ringing at the first agent. |
| Phase Agent Ring Missed | No agent was able to answer. |
| Phase Agent Ring Next | Ringing at another agent. |
| Agent Talk | The call was answered by the called party and the conversation is ongoing. |
| Hang Up Agent | The call ended with the agent hanging up and the result was recorded already before that. |
| Hang Up Caller | The call ended with the caller hanging up and the result was recorded already before that. |
| Terminated A | Call terminated by the entry rule. |
| Terminated B | Call terminated by the project rule. |
| Terminated W | Call terminated by the waiting rule. |
| Transferred A | Call transferred by the entry rule. |
| Transferred B | Call transferred by the distribution rule. |
| Transferred W | Call transferred by the waiting rule |
| Pilot | Call before entering the entry rule, i.e. before the IVR |
| Phase Announcement A | The announcement played as a part of the entry rule. |
| New | A call newly entered in the database that has not been processed yet. |
Lost Calls and Call Backs
The CallBack node can be used in the IVR. This node invokes the process of rules for the IvrCallBack mechanism. The node parameter is the number of minutes by which the call back is to be scheduled for later (or it can be scheduled immediately) This node allows the caller not to initiate waiting in the queue and, rather have an agent call them back, all that without losing the waiting position (i.e. Virtual queueing)
This mechanism generates the CallBack event with a reference to both the original lost call and the created outbound call; the relation of these calls can thus be established from the call history, with already existing forms being connected that the caller may have filled out, e.g. withing the IVR tree,
Icons
Inbound:

Outbound:

Outbound calls will appear in a table below this and use similar filters. A supervisor can view any of the calls data by clicking on either the ‘State’ Icon or the ‘Number’ in the relevant columns.
Once clicked the data will open in a new window.
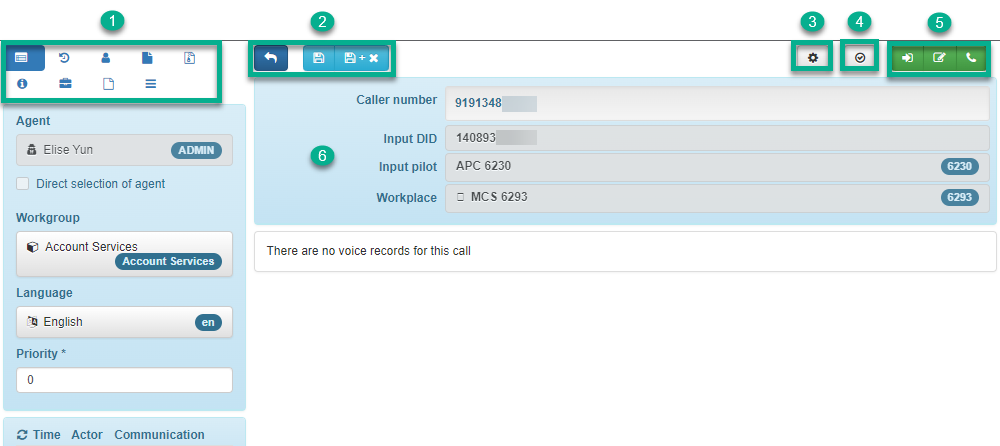
| 1 – View Buttons | Use these to toggle between, Information, History, Contact, Notes, Wrapup Code, DQ, Issue, Notes and Test |
| 2 – Action Buttons | These include, Call back, Save and Save and Close |
| 3 – Settings | Options for search, and window settings |
| 4 – Data Errors | Any errors in the form will be highlighted here, hold mouse pointer over the icon to see any notifications (the icon will change when you have errors) |
| 5 – Information | These buttons are information only and have no function |
| 6 – Call information | shows the Callers Number, the Input DID, Input Pilot and the Workplace |
Supervisor Call Select
A supervisor can pick any incoming/queuing call and send it to an agent of their choice, to do this they will need to click on the call they would like to divert:

Next click on the Bulk Action button located as shown below:

A pop up will show with a list of agents and the option to Assign, Return or Assign Directly. Choose the agent to send the call to the click Assign Directly. Leave the tick in the Reset Markers After Action then Click Execute:


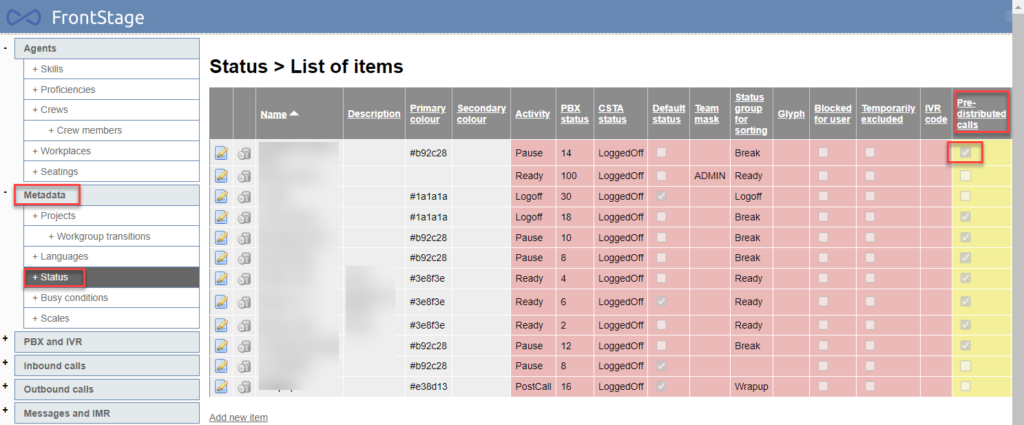
This will assign the active waiting call to the specified agent, this will be distributed to that agent when they are in Ready state or other status that allows distribution of pre-distributed calls.
The settings for the above can be found in the Admin settings under Metadata – Status:
Chats
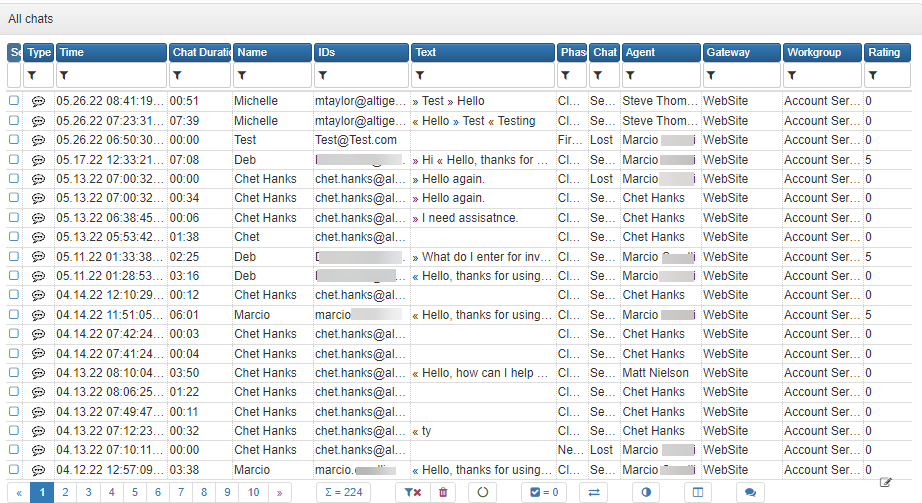
All chats can be viewed by supervisors just select the Chat option in the menu. This will open the page showing chat data, to the left of the screen will be the count of chats in queue and agents in chat. As before you have filters that can be changed to show more or less data.
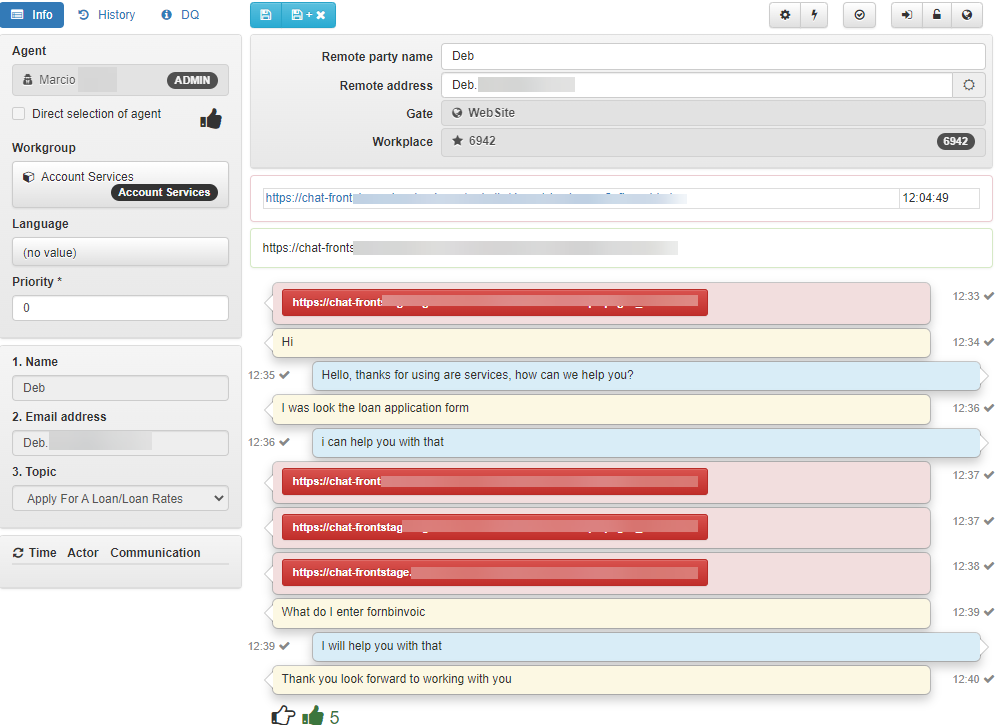
To view a chat click on the Type icon, this will open a new window with the chat details inside. This will show the chat between the agent and customer. Chat history can be viewed in here too along with the Agents name, workgroup and language plus, the customers name, email address and topic they wanted to discuss.
In this section a supervisor can view: All Messages in Queue, All Messages and All Templates.
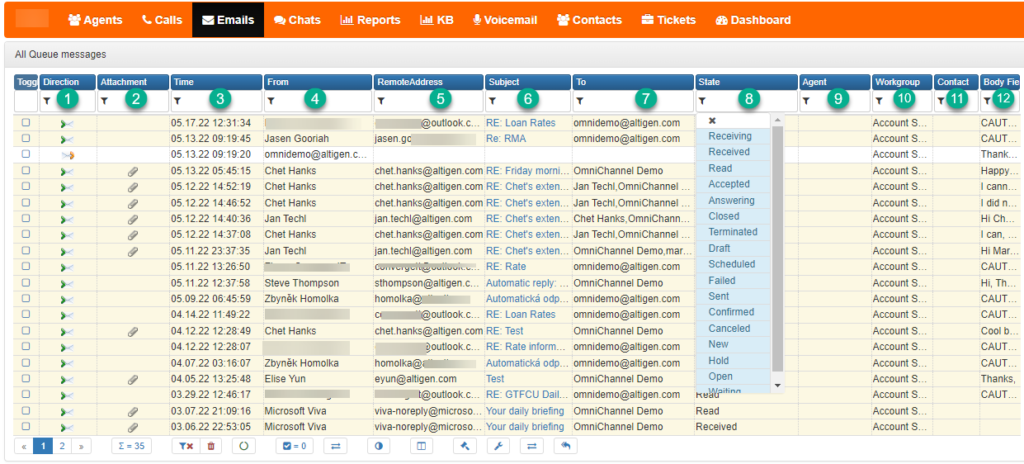
| 1 – Direction | Shows if the mail is inbound or outbound |
| 2 – Attachment | Paper clip icon appears in here if the mail has an attachment |
| 3 – Time | Date and Time the mail was sent or received |
| 4 – From | Email address of sender |
| 5 – Remote Address | This is the address extracted from the email address string from the ‘From’ header in the email |
| 6 – Subject | Email subject field |
| 7 – To | Address the email was sent to |
| 8 – State | Allows user to see what stage the email is at (see image for the drop-down options) |
| 9 – Agent | Agent who has accepted the email |
| 10 – Workgroup | Name of the workgroup the email appears in |
| 11 – Contact | If the contact is known the name will appear in this column |
| 12 – Body Field | A preview of the email |
The tables below work in the same way as the description above with the exception of the field name ‘Phase’ that replaces ‘State’.
At the bottom of this screen is a button (envelope) to create a new template.
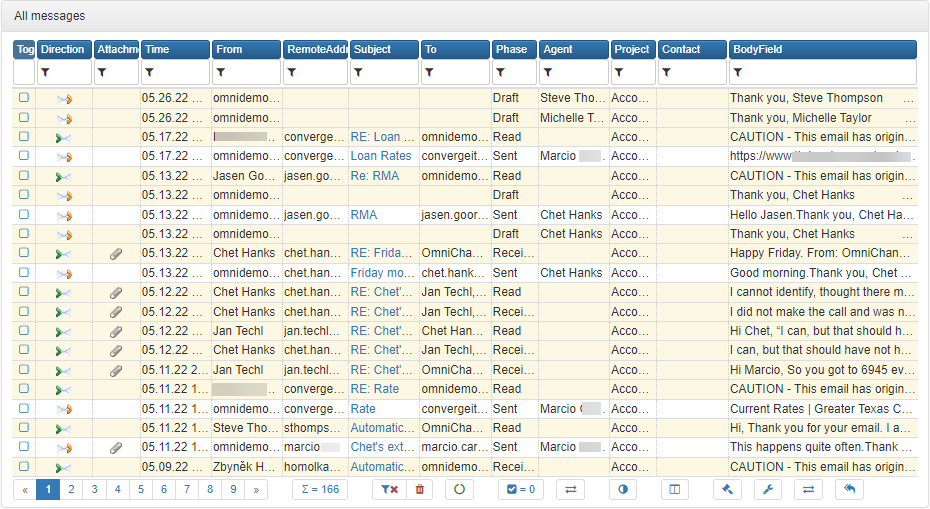

To view on any of the emails click on an icon in Direction or Subject. The email will then display in a new window.
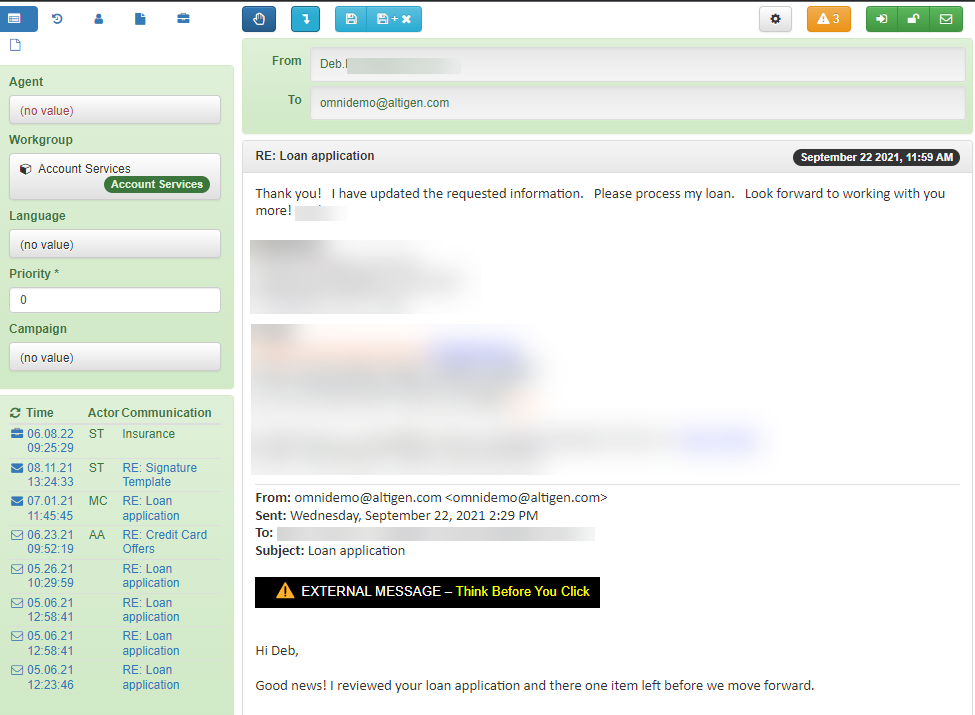

| 1 – Information | Shows the, Agent, Workgroup, Language, Priority and Campaign |
| 2 – History | Removes the information view and replaces it with the Timeline, Showing any previous messages |
| 3 – Contact | If the contact is known the information will prefill in here, if not then it can be added |
| 4 – Notes | Any notes that have been made on this email can be found here |
| 5 – Issue | View or create an issue for the email in this section, opens a new window |
| 6 – Accept | An email must first be accepted before it can be replied to |
| 7 – Go To Original | This will go back to the first message in a chain |
| 8 – Save Options | Any changes can either be saved or saved and close Window |
| 9 – Settings | Option to change some of the search options in the email view |
| 10 – Form Errors | Shows if there are any errors in the form, to view these put the mouse pointer over the icon |
| 11 – Information Icons | These are for information only and do not have a function |
Reports
Reports will be different for each company as they are customizable. When you click on the reports screen a list of available reports will be shown. Example below:
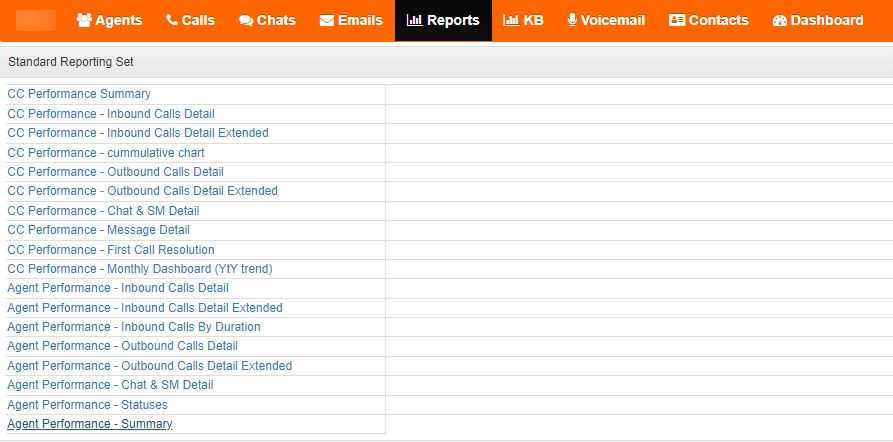
These are standard out of the box reports built on SQL. Further reports can be defined upon request.
To view a report, click on the name of the report, this will open a new window showing the details of that report from the SQL Server Reporting Services (SSRS).
KB
This is the Knowledge Base. In here you can store helpful articles and documents for a quick look up. Agents will have access to these items. Adding to the KB is a permission based feature.
Contacts
This is where the address list can be found.
Dashboard
This will show a list of all workgroups activity, below is an example image:
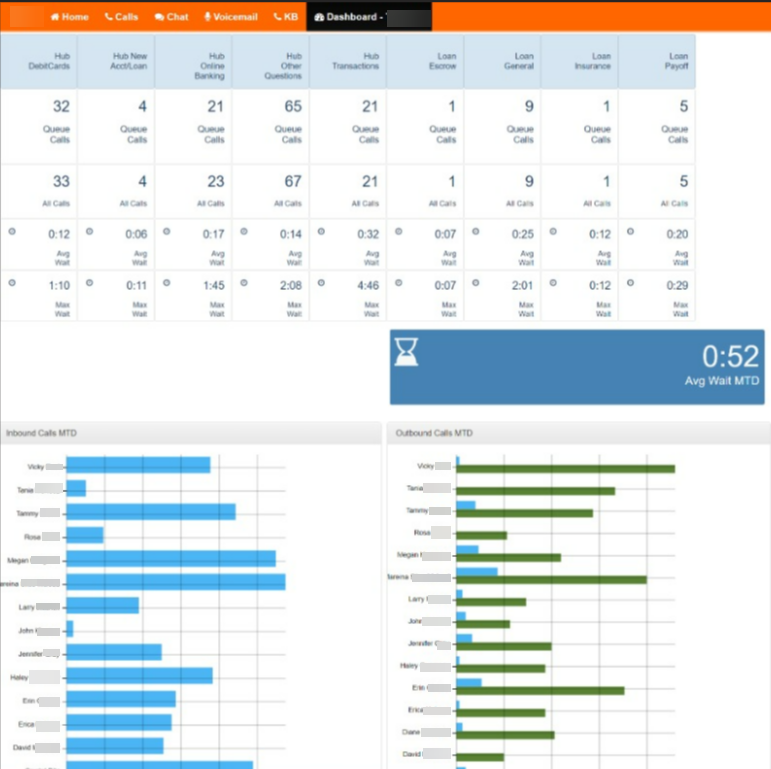
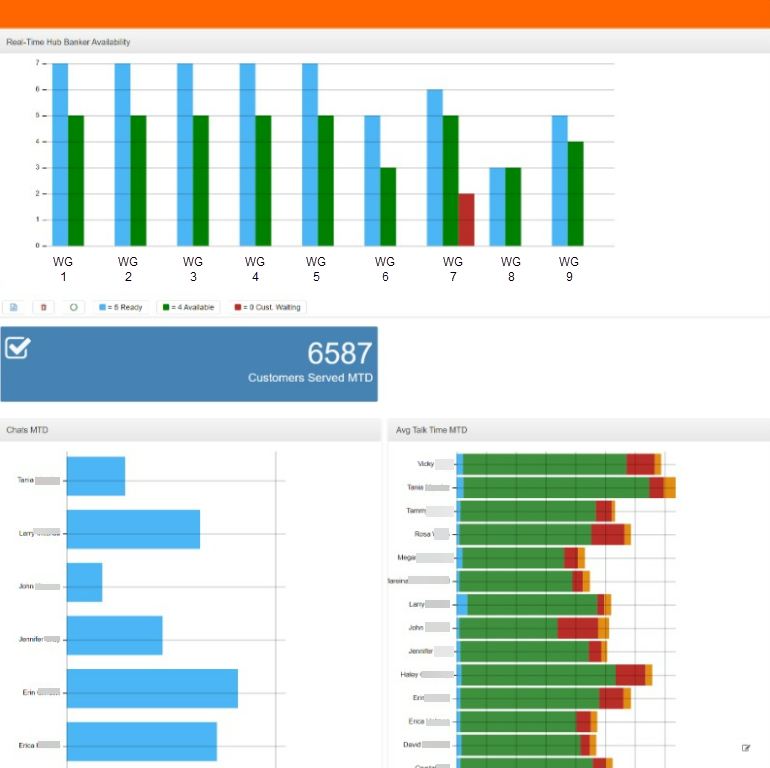
The view within Dashboards is configurable.
Reporting Sets
This section covers a wide range of available reports within FrontStage. Most reports are followed by an explanation table.
Pease Note: The screens have been divided into 2 on most of the reports to allow a better view of the data. (Top image will be the left hand side of the screen and the one below will be the right hand side)
Below is a table showing an overview of reporting sets.
| Filters and parameters | ||
| Languages | English, Czech, Slovak. By default: User browser language | |
| Profile | Automatically presets the date range available options: Today, Yesterday, This week, This month, Last month, Free for the custom date range. By default: Today | |
| Interval | Presets the cumulative interval available options: Day, Week, Month, Year. By default: Day | |
| Columns | User can pick which columns of the report are to be generated. By default all columns are visible | |
| CC Performance | ||
| Inbound | Inbound Calls volumes, drilled down to details on lost, transferred, handled inbound calls, key performance values | |
| Inbound_Extended | Extended version of Inbound, includes average and total duration of various call phases | |
| Outbound | Outbound calls volume, drilled down to details on success rate, with average duration of various call phases | |
| Outbound_Extended | Extended version of Outbound, includes average and total duration of various call phases | |
| Message | Email interaction volumes | |
| Chat and Social Media | Chat and IM interaction volumes, drilled down to details on lost/handled conversations, key performance values, average durations of conversations phases, average number of messages and characters per chat session | |
| Summary | Provides an overview of the entire contact center performance by displaying key information from detailed reports above | |
| First Call Resolution | Shows how many customer incoming enquires (within the same project) where handled during the first call interaction (i.e. no inbound not outbound follow up) | |
| Monthly Dashboard | Summary of monthly operations and KPI’s across channels: Voice in+out, email, SMS, Chat & IM focus on YOY trends | |
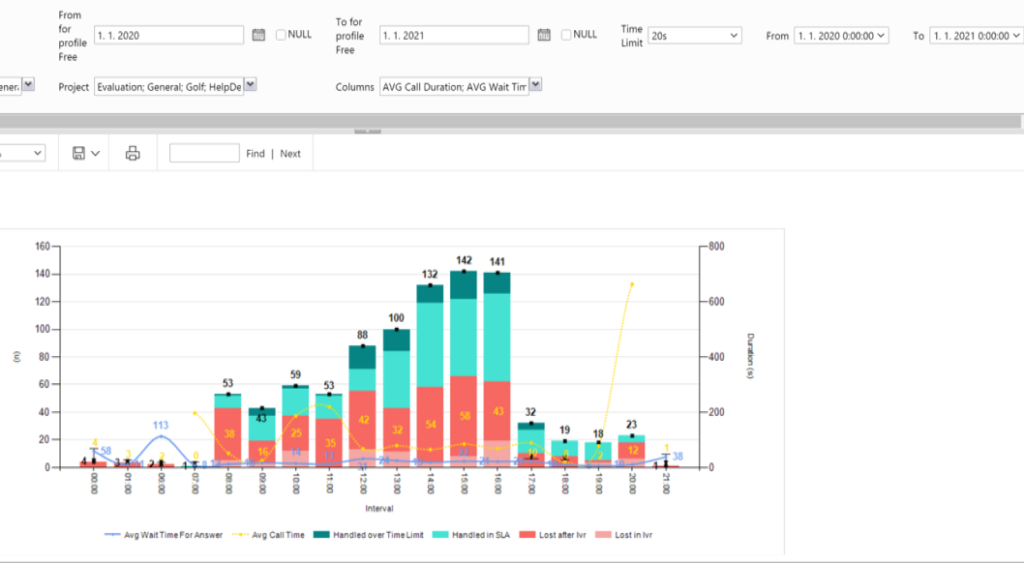
| Inbound Cumulative Chart | Shows inbound calls volume cumulations across various time periods (hour, 30 min, 15 min) and therefore helps with forecasting of staffing needs across the day | |
| Agent Performance | ||
| Inbound | Breaks down the handled Inbound calls by team and agent | |
| Inbound_Extended | Breaks down the handled Inbound calls by team and agent | |
| By Inbound Duration | Compares number of handled Inbound calls by duration | |
| Outbound | Breaks down the handled Outbound calls by team and agent | |
| Outbound_Extended | Breaks down the handled Outbound calls by team and agent | |
| Message | Breaks down the handled Emails and SMS by team and agent | |
| Chat and Social Media | Breaks down the handled Chat and IM by team and agent | |
| Statuses | Provides information related to the activity of agent(s), such as the time that an agent spends in various states, total logon time, first logon time, etc.. | |
| Summary | Provides an overview of the agent activity and performance by displaying key information from detailed reports above |
Inbound Call Report
Image from screen 1


Image from screen 2


| Column Name | Explanation |
|---|---|
| Date | Reporting Date |
| Day | Day of week/ or month/ or year – depending on the parameter ‘interval’ |
| Inbound Total | All inbound calls that day/month/year |
| Lost in IVR | All inbound calls that day/month/year that were lost in IVR or Pilot |
| %Lost in IVR | %- All inbound calls that day/month/year that were lost in IVR or Pilot/all inbound calls that day/month/year |
| Lost in Queue | All inbound calls that day/month/year that were lost in queue |
| %Lost in Queue | %- All inbound calls that day/month/year that were lost in Queue/All inbound calls that day/month/year |
| Lost IN | Total inbound calls that day/month/year that were lost (in Pilot, IVR, Queue or in Distribution) |
| Abandoned Rate | %- All inbound calls that day/month/year that were lost (in Pilot, IVR, Queue or in Distribution)/ All inbound calls that day/month/year |
| AVG in IVR & Q Time | Average time in IVR+Queue of all lost inbound calls in day/month/year |
| Handled in 20s | All inbound calls that day/month/year that were handled by agents within 20s |
| % SLA | % All inbound calls that day/month/year that were handled by agents within 20s/ All handled inbound calls that day/month/year |
| Handled Total | All handled inbound calls that day/month/year |
| % Served | % All handled inbound calls that day/month/year / All inbound calls that day/month/year |
| Transferred within CC | All inbound calls that day/month/year that were handled by agents and then transferred within CC |
| % Transferred within CC | % All inbound calls that day/month/year that were handled by agents and then transferred within CC/ All handled inbound calls that day/month/year |
| Transferred Outside CC | All inbound calls that day/month/year that were handled by agents and then transferred outside CC |
| % Transferred Outside CC | % All inbound calls that day/month/year that were handled by agents and then transferred outside CC / All handled inbound calls that day/month/year |
| In IVR Time | Average time spent in IVR of all handled inbound calls that day/month/year |
| In Queue Time | Average time spent in queue of all handled inbound calls that day/month/year |
| Ring Time | Average ring time of all handled inbound calls that day/month/year |
| Talk Time | Average talk time of all handled inbound calls that day/month/year |
| Hold Time | Average hold time of handled inbound calls that day/month/year |
| PcW Time | Average post call wrap time of all handled calls that day/month/year |
| AHT | Average Handling Time (ring+talk+hold+post call) of all handled inbound calls that day/month/year |
Inbound Extended Call Report
This report contains all the above information with the extra information described in the table below the images.
Images from screen 1


Images from screen 2


| Column Name | Explanation |
|---|---|
| In IVR Time | Total time spent in IVR of all handled inbound calls that day/month/year |
| In Queue Time | Total time spent in queue of all handled inbound calls that day/month/year |
| Ring Time | Total ring time of all handled inbound calls that day/month/year |
| Talk Time | Total talk time of all handled inbound calls that day/month/year |
| Hold Time | Total hold time of all handled inbound calls that day/month/year |
| PcW Time | Total Post call Work wrap time of all handled inbound calls that day/month/year |
| AHT | Total handling time (ring+talk+hold+post call) of all handled inbound calls that day/month/year |
Outbound Call Report
Images from screen 1


Images from screen 2


| Column Name | Explanation |
|---|---|
| Date | Reporting date |
| Day | Day/or month/ or year depending on the selected parameter ‘interval’ |
| Created | All Outgoing calls that were created by agents or system that day/month/year |
| Distributed | All Outgoing calls that were distributed to agents that day/month/year |
| Not Connected | All Outgoing calls that were distributed to agents that day/month/year but were not successful (eg. cancelled by agent, not connected, not answered by client etc.) / All distributed calls to agent that day/month/year |
| % Not Connected | % – All outgoing calls that were distributed to agents that day/month/year but were not successful (eg. cancelled by agent, not connected, not answered by client etc.) / All distributed calls to agent that day/month/year |
| AHT Time | Average handling time (routing + ring time) of all not connected outgoing calls that day/month/year |
| Connected | All Outbound calls that were distributed to agents that day/month/year that were successful (i.e. answered by client) |
| % Connected | All Outgoing calls that were distributed to agents that day/month/year that were successful (i.e. answered by client) / All distributed calls to agent that day/month/year |
| Transferred within CC | All Outbound calls that day/month/year that were handled by agents and then transferred within CC |
| % Transferred within CC | % All Outbound calls that day/month/year that were handled by agents and then transferred within CC / All handled outbound calls that day/month/year |
| Transferred Outside CC | All Outbound calls that day/month/year that were handled by agents then transferred outside CC |
| % Transferred Outside CC | % All Outbound calls that day/month/year that were handled by agents and then transferred outside CC / All handled outbound calls that day/month/year |
| Ring Time | Average ringing time of all connected outgoing calls that day/month/year |
| Talk Time | Average talk time of all connected outgoing calls that day/month/year |
| Hold Time | Average hold time of all connected outgoing calls that day/month/year |
| PcP Wrap Time | Average post call wrap time of all connected outgoing calls that day/month/year |
| AHT | Average Handling time (ring+talk+hold+post call) of all connected outgoing calls that day/month/year |
Outbound Extended Call Report
This report contains all the information as the above and average times as described in the below table.
Images from screen 1


Images from screen 2


| Column Name | Explanation |
|---|---|
| Ring Time | Total ring time of all connected outgoing calls that day/month/year |
| Talk Time | Total talk time of all connected outgoing calls that day/month/year |
| Hold Time | Total hold time of all connected outgoing calls that day/month/year |
| PcP Wrap Time | Total post call wrap time of all connected outgoing calls that day/month/year |
| AHT | Total handling time (ring+talk+hold+post call) of all connected outgoing calls that day/month/year |
Message Report


| Category | Column Name | Explanation |
|---|---|---|
| Date | Reporting date | |
| Day | Day/or month/or year depending on the selected parameters ‘interval’ | |
| Total in Queue | Total emails in queue that day – newly delivered that day + all other emails from previous periods that were not yet answered (i.e. either still not assigned waiting in queue or already being processed but not yet finished by an agent) | |
| New Delivered | Emails delivered that day/month/year | |
| % New Delivered | % Emails delivered that day/month/year/ Total email queue that day/month/year | |
| In Queue | All other emails from previous intervals that were not yet answered (i.e. either still not assigned waiting in queue or already being processed but not yet finished by an agent) | |
| % In Queue | % All other emails from previous interval that were not yet answered (i.e. either still not assigned waiting in queue or already being processed but not yet finished by an agent) / Total email queues that day/month/year | |
| Answered | All outgoing emails sent that day/month/year as an answer to incoming email, including forwarded emails | |
| % In 24 Hours | % All emails answered that day/month/year within 24 hours / All answered emails that day/month/year | |
| AHT | Average email handling time – average time that day/month/year answered emails waited to be replied (Reply Sent Time – Incoming Email Delivery Time) | |
| AWT | Average email waiting time – average time that day/month/year answered emails waited in queue to be distributed and accepted for processing by an agent | |
| Closed | All incoming emails that were closed without reply that day/month/year without a reply | |
| Spam | All incoming emails that were closed and marked as spam that day/month/year without a reply | |
| New Outgoing | All new outgoing emails that were sent that day/month/year | |
| AHT Answered | Average agent handling time of answered (and forwarded) emails that day/month/year (Reply Sent Time – Accepted Time) | |
| AHT Closed | Average agent handling time of closed emails (closed without reply) that day/month/year (Closed Time – Accepted Time) | |
| AHT Spam | Average agent handling time of closed emails marked as spam that day/month/year (Closed Time – Accepted Time) | |
| AHT Out | Average agent handling time of new outgoing emails sent that day/month/year | |
| SMS | SMS Answered | All SMS replies sent that day/month/year |
| SMS | SMS New Out | All new SMS sent that day/month/year |
Chat and Social Media Reports
Images from screen 1


Images from screen 2


| Category | Column Name | Explanation |
|---|---|---|
| Chat/Social Media | Date | Reporting date |
| Chat/Social Media | Interval | Day of week/ or month/ or year – depending on the parameter ‘Interval’ |
| Chat | Offered | All incoming chat conversations that day/month/year |
| Chat | Lost | All incoming chat conversations that day/month/year that were lost, no agent accepted the conversation |
| Chat | % Lost | % All incoming lost chat conversations that day/month/year / All incoming chat conversations that day/month/year |
| Chat | AWT Lost | Average time in ICR+Queue of all lost incoming conversations in day/month/year |
| Chat | Handled | All incoming chat conversations that day/month/year that were handled by agents |
| Chat | % Handled | % All incoming chat conversations that day/month/year that were handled by agents / All incoming chat conversations that day/month/year |
| Chat | % Accepted in 40s | % All incoming chat conversations that day/month/year that were accepted by agents in 40s / All incoming chat conversations that day/month/year |
| Chat | % First Reply in 40s | % All incoming chat conversations that day/month/year that were actually answered by agents in 40s/ All incoming chat conversations that day/month/year |
| Chat | AWT for Accept | Average time chat conversations had been waiting until they were accepted by an agent for processing |
| Chat | AWT for First Reply | Average time clients have been waiting until they received the first reply from an agent |
| Chat | AHT Client PoV | Average handling time from client point of view, i.e. from start to end of the chat conversation |
| Chat | AVG Alert Time | Average alert time of all handled chat conversations that day/month/year |
| Chat | AHT Agent PoV | Average handling time of all handled chat conversations that day/month/year from agent point of view, i.e. from accepting until the end of the conversation |
| Chat | AVG Client Replies | Average number of messages sent by client per handled conversation that day/month/year |
| Chat | AVG Agent Replies | Average number of messages sent by agent(s) per handled conversation that day/month/year |
| Chat | AVG Client Reply Length | Average number of characters in a message sent by client per handled conversation that day/month/year |
| Chat | AVG Agent Reply Length | Average numbers of characters in a message sent by agent per handled conversation that day/month/year |
| Social Media | Offered | All incoming IM conversations that day/month/year |
| Social Media | Lost | All incoming IM conversations that day/month/year that were lost, no agent accepted the conversation |
| Social Media | % Lost | % All incoming lost IM conversations that day/month/year / All incoming IM conversations that day/month/year |
| Social Media | AWT Lost | Average time in ICR+Queue of all lost incoming conversations in day/month/year |
| Social Media | Handled | All incoming IM conversations that day/month/year that were actually handled by agents |
| Social Media | % Handled | % All incoming IM conversations that day/month/year that were handled by agents / All incoming IM conversations that day/month/year |
| Social Media | % Accepted in 40s | % All incoming IM conversations that day/month/year that were accepted by agents in 40s / All incoming IM conversations that day/month/year |
| Social Media | % Reply in 40s | % All incoming conversations that day/month/year that were actually answered by agents in 40s / All incoming IM conversations that day/month/year |
| Social Media | AWT for Accept | Average time IM conversation s have been waiting until they were accepted by agents for processing |
| Social Media | AWT for First Reply | Average time the clients have been waiting until they received the first reply by agent |
| Social Media | AHT Client PoV | Average handling time from client point of view i.e. from start to end of the IM conversation |
| Social Media | AVG Alert Time | Average alert time of all handled IM conversations that day/month/year |
| Social Media | AHT Agent PoV | Average handling time of all handled IM conversations that day/month/year from agent point of view, i.e. from accepting until the end of the conversation |
| Social Media | AVG Client Replies | Average number of messages sent by client per handled IM conversation that day/month/year |
| Social Media | AVG Agent Replies | Average number of messages sent by agent(s) per handled IM conversation that day/month/year |
| Social Media | AVG Client Reply Length | Average number of characters in a message sent by client per handled IM conversation that day/month/year |
| Social Media | AVG Agent Reply Length | Average number of characters in a message sent by agent per handled IM conversation that day/month/year |
Summary Report
Images from screen 1


Images from screen 2


| Column Name | Explanation |
|---|---|
| Date | Reporting date |
| Day | Day/or Month/or Year depending on the selected parameter ‘Interval’ |
| Team Name | Agent’s Team Name |
| Agent Name | Agent’s Name |
| Inbound Calls | Number of handled inbound calls by the agent that Day/or Month/or Year |
| Transferred Calls | Number of handled inbound calls that were transferred within CC/Outside CC by the agent that Day/or Month/or Year |
| Outbound Calls | Number of handled outbound calls by the agent that Day/or Month/or Year |
| Missed Rings | Number of calls when the agent failed to answer the inbound/outbound call offer |
| Answered Emails | Number of answered incoming emails by the agent that Day/or Month/or Year |
| New Outgoing Emails | Number of new outgoing emails sent by the agent that Day/or Month/or Year |
| Login Time | Time when the agent logged into FrontStage for the first time that day |
| Logout Time | Time when the agent logged out of FrontStage for the last time that day |
| Total Logon | Total agent’s logon time that Day/Month/Year |
| Total Ready | Total time the agent spent in “Ready” state that Day/Month/Year |
| Total Not Ready | Total time the agent spent in “Not Ready” that Day/Month/Year |
| Ready Time Detail | Total Ready time drilled down to each ready state predefined in the administration |
| Not Ready Detail | Total Not Ready time drilled down to each ready state predefined in the administration |
Example reports
Below is an example of a report of agent status.


Example of an agent performance by inbound duration report:


Example of an inbound cumulative chart:

First Call Resolution Report

| Column Name | Explanation |
|---|---|
| Interval | Last 24hr/ last 48hr/ last 7 days |
| Handled IN Calls | All handled incoming calls within the Interval selected |
| Handled IN First Call | All handled incoming calls within the Interval selected, that were resolved in first client’s call and by one single agent (i.e. call was neither transferred to another agent/or outside CC) or another inbound call or outbound call from/to the same phone number within the same project had been made |
| % First Contact Resolution | % Handled incoming calls in first call/ All handled incoming calls within the Interval |
| AHT First Contract | Average handling time (ring+talk+hold+post call wrap time) of all calls handled in first contact with the client within the Interval selected |
| Handled IN First Call and Transferred | All handled incoming calls within the Interval selected, that were resolved in first client’s call but were handled by more than one agent (i.e. transferred within CC) or transferred outside CC (additional inbound or outbound call from/to the same phone number within the same project had not been made) |
| % First Call Resolution | % Incoming calls handled in first call with a transfer either within CC or outside CC/ All handled incoming calls within the Interval selected |
| AHT First Call | Average handling time (ring+talk+hold+post call wrap time) of all calls handled in first call with a transfer within CC/ outside CC within the Interval selected |
| Handled In and Out Multiple Calls | All calls handled within the Interval selected, when multiple inbound or outbound calls from/to the same phone number within the same project has been made |
| Number of Clients | Number of clients whose queries had been handled in multiple (in+out) calls |
| AVG Calls Per Client | Average number of multiple handled calls (in+out) per client made within the Interval selected |
| AHT Multiple Calls | Average handling time (ring+talk+hold+post call wrap time) of all calls handled in multiple in+out calls within the Interval selected |
Monthly Dashboard


| Column/Chart Name | Explanation |
|---|---|
| In Handled | All inbound calls handled in actual month |
| % YtD Change | % Year to year trend or total handled calls |
| Transferred In | % Of all inbound calls handled that month that where transferred within the CC, below sparkline showing last year trend |
| Transferred Out | % Of all outbound calls handled that month that where transferred outside the CC, below sparkline showing last year trend |
| Inbound Call Trend Chart | Year to year comparison of all incoming calls (forecast, actual year, last year) on monthly basis |
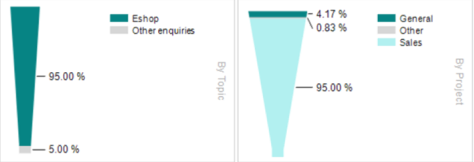
| Inbound Calls by Project & Topic | All handled calls in the actual month drilled down by Call, Project and Ticket Topic |
| Out Handled | All connected outbound calls handled in actual month |
| % YtD Change | % Year to year trend of total connected outbound calls |
| Connected | % Of all distributed outbound calls that were successfully connected with client that month, below sparkline showing last year trend |
| AVG AHT | Average handling time of connected outbound calls that month, below sparkline showing last year trend |
| Outbound Call Trend Chart | Year to year comparison of all outgoing calls connected / not connected (actual year, last year) on monthly basis |
| Outbound Calls by Project & Topic | All connected outbound calls in the actual month drilled down by Call, Project and Ticket Topic |
| @ Handled | All handled email in the actual month |
| % YtD Change | % Year to year trend total handled emails |
| AVG AHT | Average handling time of all incoming emails answered that month, below sparkline showing last year trend |
| AVG AWT | Average wait time for assignment to an agent of all incoming emails answered that month, below sparkline showing last year trend |
| Email Trend Chart | Year to year comparison of all answered and new outgoing emails handled (actual year vs. last year) on monthly basis |
| Emails by Project & Topic | All handled emails in the actual month drilled down by Call, Project and Ticket Topic |
| SLA Gauge | Gauge showing inbound call SLA goal fulfilment that month in % |
| AVG AHT | Average handling time (ring+talk+hold+post call) of handled inbound calls that month |
| AVG Ring Time | Average ring time of all handled inbound calls that month |
| AVG Talk Time | Average talk time of all handled inbound calls that month |
| AVG Hold Time | Average hold time of all handled inbound calls that month |
| AVG Post Call Wrap Time | Average post call wrap time of all handled inbound calls that month |
| SLA Trend Chart | SLA performance trend – last year performance vs actual year, goal indicator |
| Abandoned Rate Gauge | Gauge showing inbound call abandoned rate goal fulfilment that month in % |
| Total Lost | Total inbound calls that month that were lost |
| Lost in IVR | % – All inbound calls that month that were lost in IVR or Pilot/ All lost calls that month |
| Lost in Queue | & – All inbound calls that month that were lost in Queue / All lost calls that month |
| AVG Time in IVR | Average time in IVR of all lost inbound calls that month |
| AVG Time in Queue | Average time in Queue of all lost inbound calls that month |
| Abandoned Rate Trend Chart | Abandoned rate trend – last year performance vs actual year, goal indicator |
